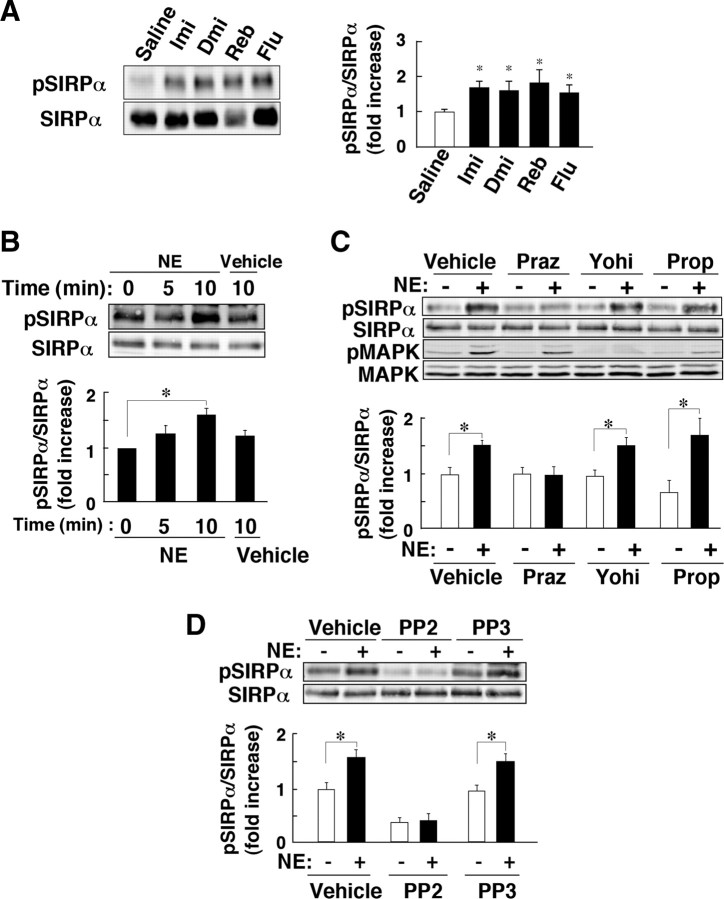
Figure 4.
Antidepressants and NE induce tyrosine phosphorylation of SIRPα. A, WT mice were treated with imipramine (Imi), desipramine (Dmi), reboxetine (Reb), fluoxetine (Flu), or saline. Hippocampal homogenates were prepared 5 min after drug administration and subjected to immunoblot analysis with anti-pSIRPα or pAbs to SIRPα. The ratio of the intensity of the pSIRPα band to that of the SIRPα band is presented as fold increase relative to the control (Saline) value; data are means ± SEM. for a total of six mice for each condition in three independent experiments. *p < 0.05 versus saline value (Student's t test). B, Cultured mouse hippocampal neurons (18 d in vitro) were exposed for the indicated times to 10 μm NE or vehicle (distilled water), after which cell lysates were prepared and subjected to immunoblot analysis as in A. C, Mouse hippocampal neurons were incubated first for 30 min with 10 μm prazosin (Praz), 10 μm yohimbine (Yohi), 10 μm propranolol (Prop), or vehicle (distilled water) and then for 10 min in the additional absence or presence of 10 μm NE. Cell lysates were then subjected to immunoblot analysis with anti-pSIRPα, pAbs to SIRPα, or pAbs to phosphorylated (pMAPK) or total (MAPK) forms of MAPK. D, Mouse hippocampal neurons were incubated first for 30 min with 20 μm PP2 or PP3 or with vehicle (dimethyl sulfoxide) and then for 10 min in the additional absence or presence of 10 μm NE. Cell lysates were then subjected to immunoblot analysis as in A. In B–D, the ratio of the intensity of the pSIRPα band to that of the SIRPα band is expressed as fold increase relative to the corresponding control value; data are means ± SEM. for three independent experiments. *p < 0.05, Student's t test.

