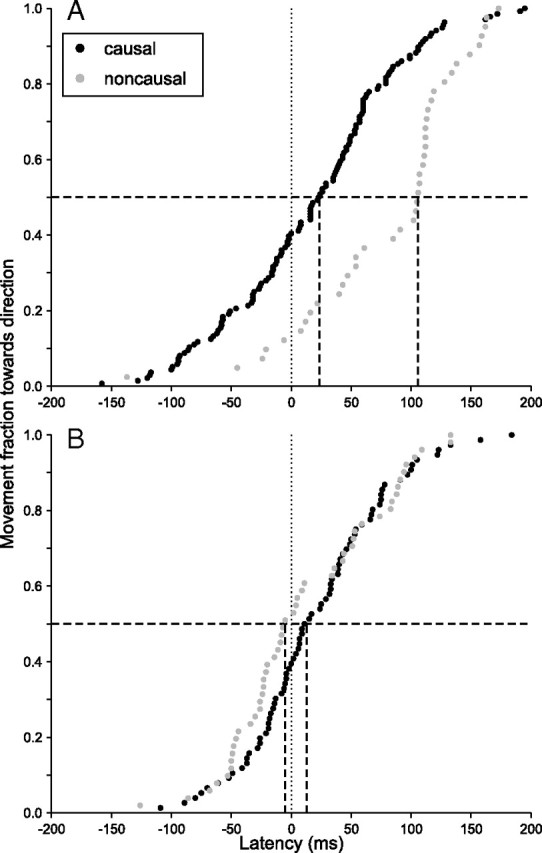
Figure 5.

Cumulative frequency plots of pursuit onset time toward the causal or noncausal target, with the same data as in Figure 3 (subject CK, experiment 2). The dashed lines indicate median values. A, Standard trials. Note that movements generally began earlier toward the causal target. B, No-tool trials. The latency difference is no longer significant.
