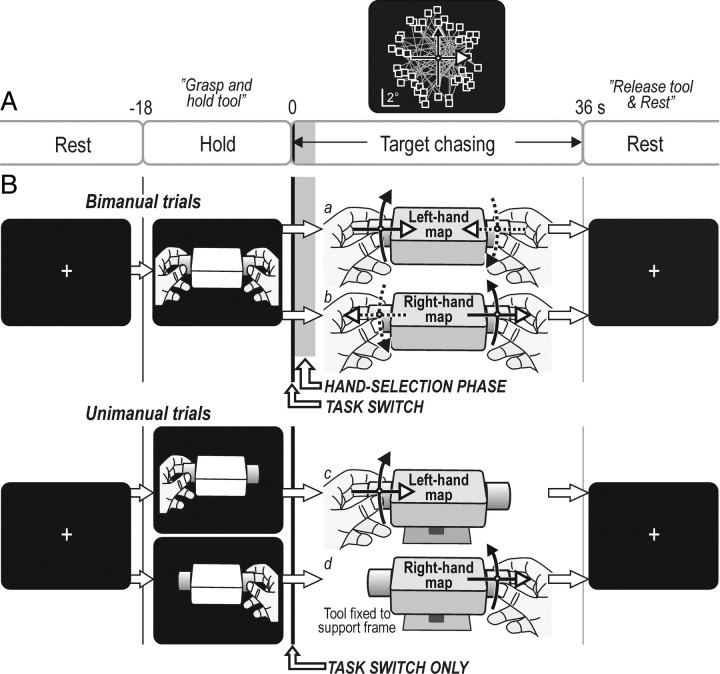
Figure 1.
Apparatus, experimental design, and target distribution on screen. A, Each trial involved a hold task (18 s) during which a picture instructed the participant how to grasp the tool (see B), followed by the target-chasing task (36 s) and a rest period (18 s) in which the participant first released the tool and then rested while fixating a crosshair. The top graph shows the distribution of target positions (squares) with the cursor shown in the center of the screen (white dot). Straight lines connect consecutively appearing targets. The width of the vertical gray bar initially during the target-chasing task indicates the time of the hand-selection phase in bimanual trials (averaged across participants). The width of the vertical solid black line indicates the time between the appearance of the first target and the start of cursor movements (task initiation). B, Tool used by the participants to control the cursor by bimanually (a and b) or unimanually (c and d) applying linear forces and torques to the tool. The corresponding solid line arrows in top graph of A indicate the two different mapping rules relating forces and torques to cursor movements, i.e., the left-hand and the right-hand mapping rule. For the unimanual trials (c and d), the left-hand and the right-hand mapping rule was applied when the left and right hand acted, respectively. Note that selection of the prime actor occurred initially during the target-chasing task only in the bimanual trials (hand-selection phase), whereas a switching from the hold task to the target-chasing task occurred for all trial types.

