
Figure 6.
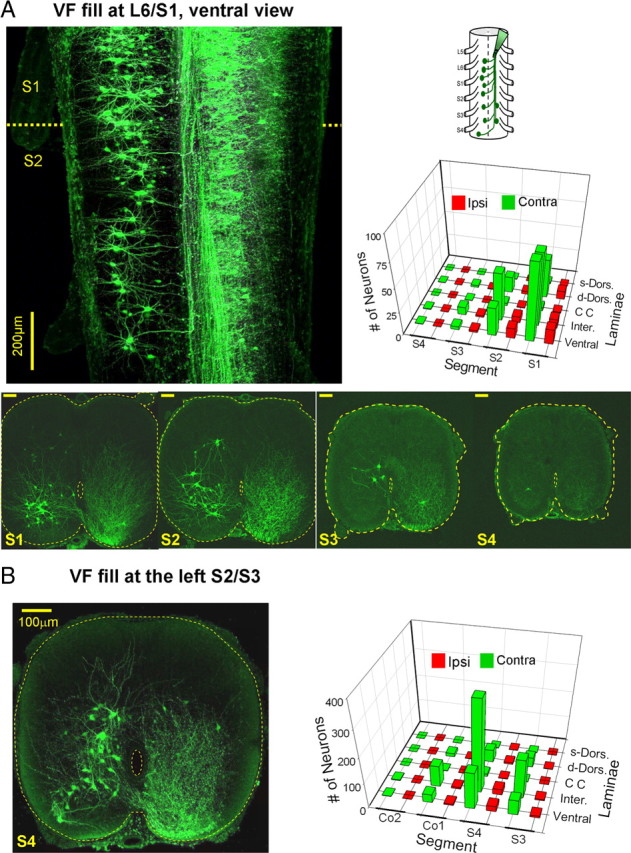
Rostrally projecting VF neurons. A, Schematic ventral view of backfilling of cut VF axon bundles with fluorescein dextran at the left lumbosacral junction is shown on the right. A projected confocal image of sacral neurons labeled through the cut VF axons at the left lumbosacral junction in a whole mount transparent preparation of the spinal cord. This image is composed of a sample of 20 consecutive optical slices, 8 μm each, scanned from the ventral aspect of the whole mount preparation. Projected confocal images of 70-μm-thick cross sections through the S1, S2, S3 and S4 of a different preparation are superimposed below. Calibration bars: 100 μm; the perimeter of the cross sections and the central canal are delineated by dashed lines. Note the predominance of contralaterally filled neurons, the decrease in the number of cells in the caudal direction and, the course of the crossing axons onto the ascending VF. The three dimensional histogram on the right shows the mean segmental and laminar distribution of contra (green) and ipsilaterally (red) labeled neurons in the 12 labeling experiments performed in this series. s- and d-Dorsal, Superficial (laminae I–IV) and deep (laminae V and VI) dorsal laminae; respectively; CC, laminae X neurons around the central canal; Inter., lamina VII; Ventral, laminae VIII and IX. B, Confocal projected image of cross section through the S4 segment following retrograde VF labeling with fluorescein dextran loaded via the cut VF at the S2/S3 junction. The segmental and laminar distribution of the labeled neurons in 3 experiments is shown in a 3D histogram on the left. Note that neurons were labeled in S3–Co2 mainly contralateral to the fill. The projected image is composed of 10 optical slices, 8 μm each. For abbreviations, see Fig. 6A.