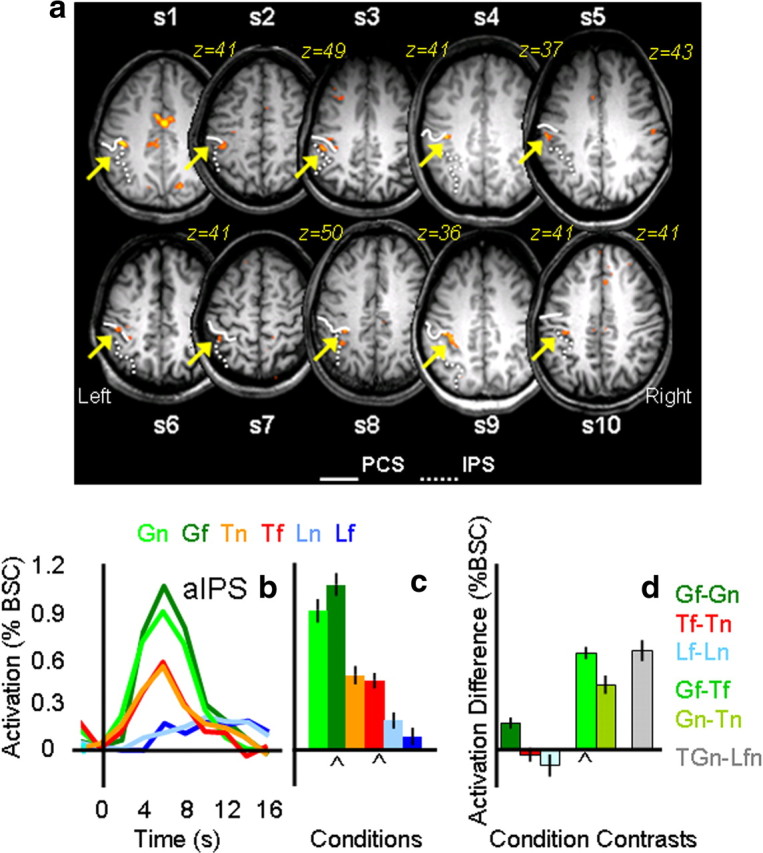
Figure 2.

Individual statistical maps and activation levels across conditions for the aIPS region of interest in experiment 1. a, The position of the left aIPS, localized by comparing Gf versus Tf, is shown in the most clear transverse slice (z value) for each of the 10 participants. In each participant, aIPS (highlighted by a yellow arrow) was identified at the junction of the anterior end of the intraparietal sulcus (dotted line) and the inferior segment of the PCS (solid line). b, Line graphs show the event-related average time courses for the six experimental conditions in the left aIPS with time 0 indicating the onset of the visual stimuli. c, The bar graph displays the average magnitude of peak activation (%BSC) in each experimental condition for the group. d, The bar graph displays differences in average peak activations (%BSC) between key conditions. Error bars represent 95% confidence intervals such that difference scores with error bars that do not include zero indicate that the difference was significant at p < 0.05, two-tailed t test. The chevron (⋀) highlights the experimental conditions and contrast used to localize each ROI, indicating which conditions and contrasts may be susceptible to the nonindependence error. Statistical values for the %BSC peak activation differences are as follows: Gf > Gn, p = 0.0005; Tf = Tn, p = 0.2; Lf = Ln, p = 0.09; Gf > Tf, p = 0.0001; Gn > Tn, p = 0.0001; GTn > Lnf, p = 0.0001.
