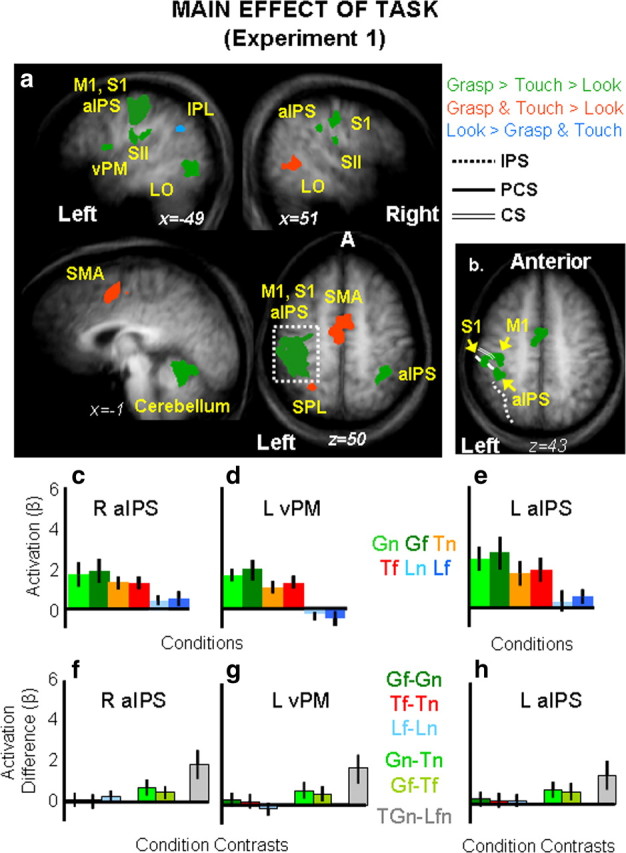
Figure 4.

Group statistical maps and activation levels for areas showing a main effect of task in experiment 1. a, Each region that showed a significant main effect of task in the voxelwise ANOVA for experiment 1 is color coded based on the pattern of activation, as indicated in the legend. The group activation map is based on the Talairach averaged group results shown on the averaged anatomical map. Talairach coordinates for the activated areas and p values for the relevant statistical comparisons are shown in Table 1. b, Brain areas surviving a more conservative threshold (p < 0.0001, Bonferroni corrected) for the same main effect of task revealed distinct foci of activation within left M1, left S1, and left aIPS. c–h, The bar graphs display average and differences for β weights within key areas in the grasping network: right aIPS (c, f), left vPM (d, g) and left aIPS (e, h). Statistical values for the β weight differences in left vPM, left aIPS, and right aIPS are as follows: Left vPM: Gf = Gn, p = 0.67; Tf = Tn, p = 0.31; Lf = Ln, p = 0.42; Gf > Tf, p = 0.007; Gn > Tn, p = 0.004; GTn > Lnf, p = 0.0001; left aIPS: Gf = Gn, p = 0.146; Tf = Tn, p = 0.185; Lf = Ln, p = 0.134; Gf > Tf, p = 0.0018l Gn > Tn, p = 0.005; GTn > Lnf, p = 0.0008; right aIPS: Gf = Gn, p = 0.53; Tf = Tn, p = 0.3; Lf = Ln, p = 0.55; Gf > Tf, p = 0.003; Gn > Tn, p = 0.003, GTn > Lnf, p = 0.0001. aIPS, Anterior intraparietal sulcus; CS, central sulcus; IPL, inferior parietal lobe; IPS, intraparietal sulcus; L, left; LOC, lateral occipital complex; M1, primary motor cortex; PCS, postcentral sulcus; R, right; S1, primary somatosensory cortex; SII (S2), secondary somatosensory area; SMA, supplementary motor area; SPL, superior parietal lobe; vPM, ventral premotor cortex.
