
Figure 6.
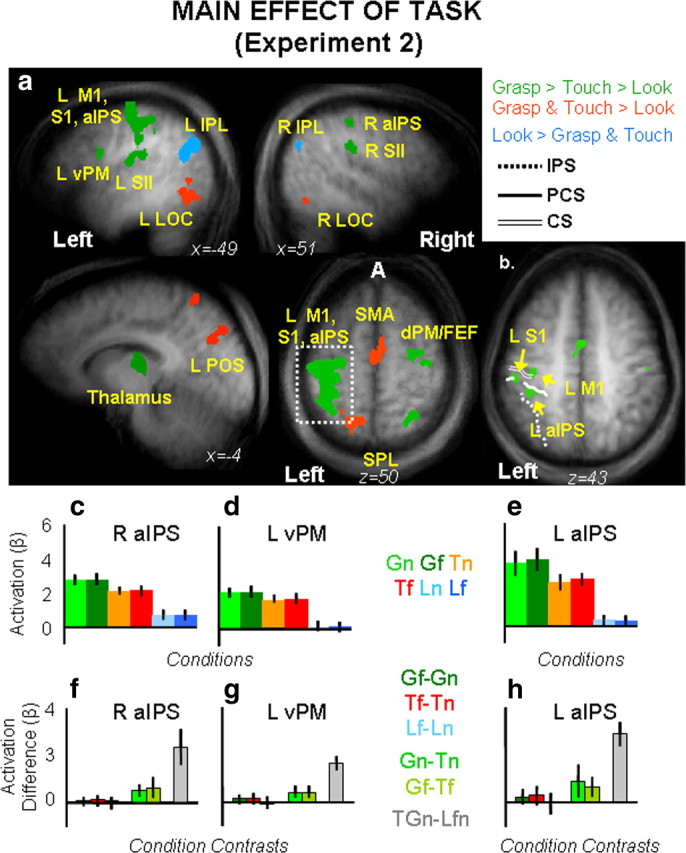
Group statistical maps and activation levels for areas showing a main effect of task in experiment 2. a, Each region that showed a significant main effect of task in the voxelwise ANOVA for experiment 2 is color coded based on its pattern of activations, as indicated in the legend. Talairach coordinates for the activated areas and p values for the relevant statistical comparisons are shown in Table 3. b, Brain areas that survived a more conservative threshold (p < 0.0001, Bonferroni corrected) for the same main effect of task revealed separate activations within left M1, left S1, and left aIPS. c–h, The bar graphs display average and differences for β weights in each experimental condition within key areas in the grasping network: right aIPS (c, f), left vPM (d, g), and left aIPS (e, h). Labels and conventions are as in previous figures. β weight differences in left vPM, left aIPS, and right aIPS are as follows: Left vPM: Gf = Gn, p = 0.75; Tf = Tn, p = 0.71; Lf = Ln, p = 0.43; Gf > Tf, p = 0.009; Gn > Tn, p = 0.007; GTn > Lnf, p = 0.0001; left aIPS: Gf > Gn, p = 0.094; Tf = Tn, p = 0.103; Lf = Ln, p = 0.409; Gf > Tf, p = 0.007; G > Tn, p = 0.003; GTn > Lnf, p = 0.0001; right aIPS: Gf = Gn, p = 0.73; Tf = Tn, p = 0.43; Lf = Ln, p = 0.65; Gf > Tf, p = 0.0003; Gn > Tn, p = 0.0031; GTn > Lnf, p = 0.0001.