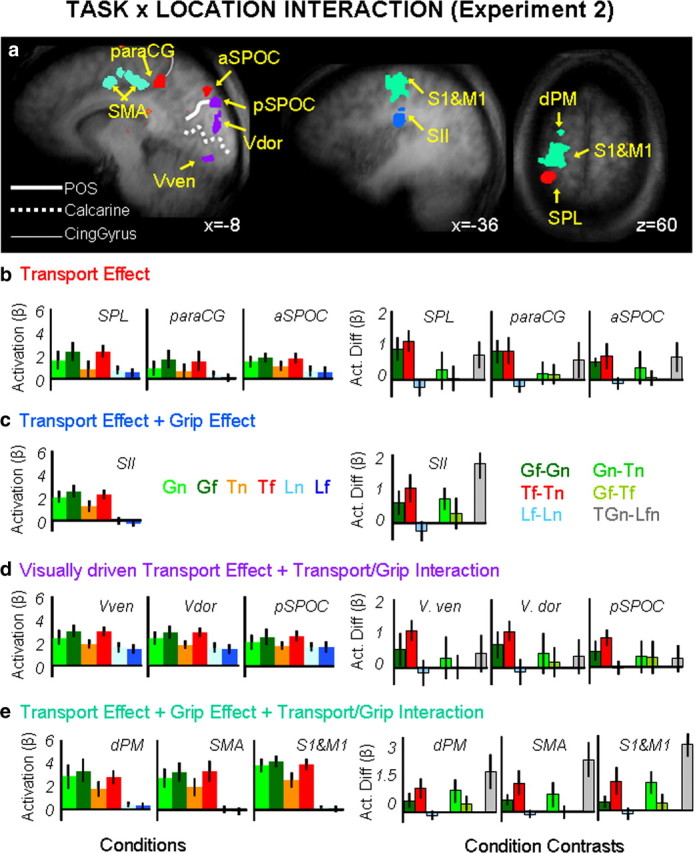
Figure 7.

Group statistical maps and activation levels for areas showing an interaction of task × location in experiment 2. a, Brain areas are depicted according to the specific pattern of activation they displayed as indicated by color labels for b, c, d, and e. The group activation map is based on the Talairach averaged group results shown on one averaged anatomical map. b–e, Bar graphs show averaged β weights (left panels) and differences in β weights between key conditions (right panels) for the transport effect-related areas (b), the transport effect plus grip effect related areas (c), the visually driven transport effect related areas (d), and the transport effect-, grip effect-, and transport/grip interaction effect-related areas (e). Labels and conventions as in previous figures. Vven, visual ventral; Vdor, visual dorsal.
