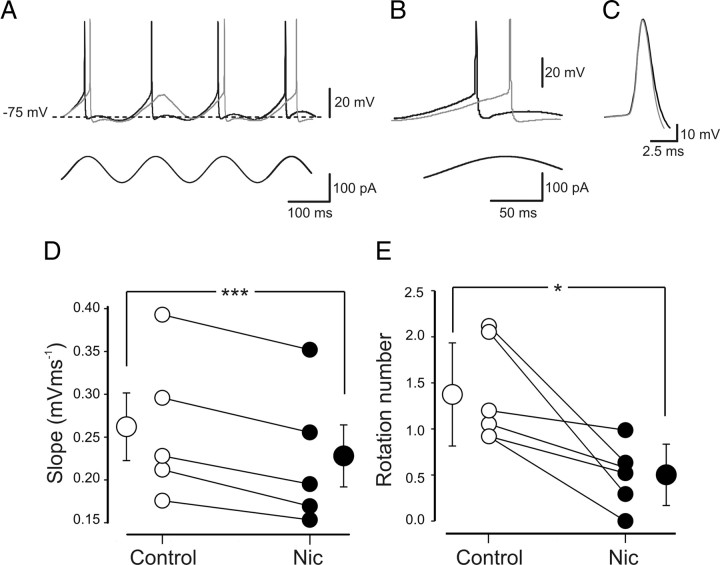
Figure 10.
Nicotine slows down the depolarizing voltage slopes induced by subthreshold oscillations in the theta frequency range. A, Two superimposed traces of voltage responses to injected steady subthreshold sinusoidal currents in control (black) or in the presence of nicotine (gray). Nicotine slowed down the slope and reduced the number of action potentials. B, The reduction in the depolarizing voltage slope shown in A is represented on an expanded timescale. C, Two action potentials from the traces in A are superimposed at a different timescale. D, Each symbol represents the slope value of individual cells measured in control (open circles) or in the presence of nicotine (Nic; filled circles). E, Each symbol represents the rotation number (average spikes per cycle) of individual cells obtained in control (open circles) or in the presence of nicotine (filled circles). *p < 0.05; ***p < 0.001.

