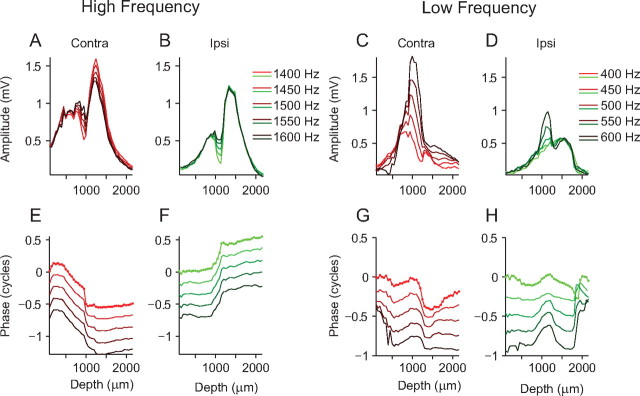
Figure 2.
Amplitude dips and phase shifts in the neurophonic. A, B, The analysis as shown in Figure 1D is replotted for a different dataset for contralateral (A) and ipsilateral (B) amplitude over a range of frequencies (1400–1600 Hz, indicated by different shades of red and green). C, D, Same electrode penetration as A and B but for a lower range of stimulus frequencies (400–600 Hz). E, F, Phase measurements, derived from Fourier analysis of the neurophonic at each depth, for contralateral (E) and ipsilateral (F) stimulation. The dots on the upper line mark individual measurement depths (50 μm intervals). Zero phase was taken as the phase of the lowest stimulus frequency at the first depth measurement. G, H, Same as E and F but for a lower range of frequencies.

