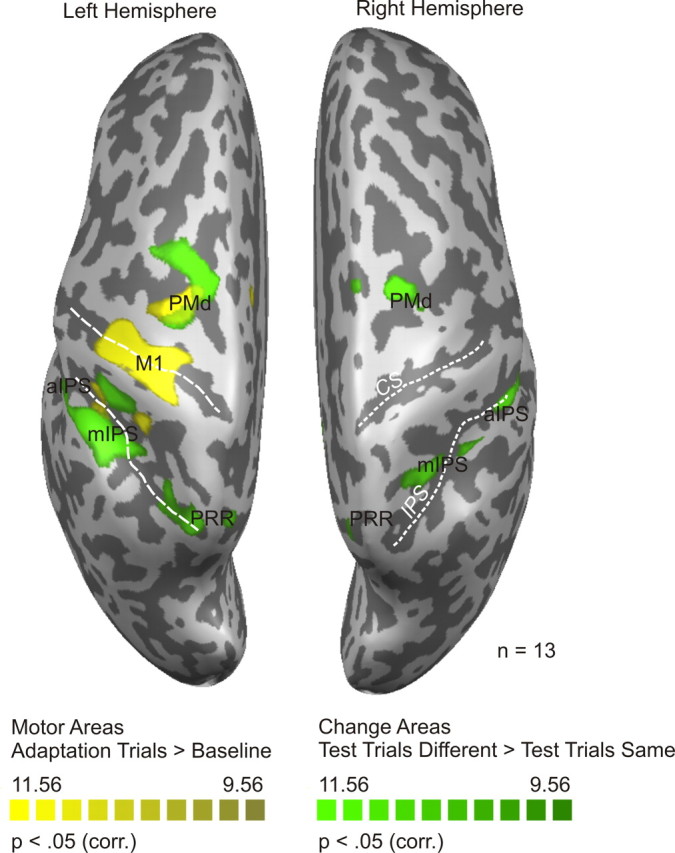
Figure 4.

Statistical map of experiment 1. Motor areas and change areas are shown in yellow and green, respectively (for details, see Results). Functional data (Bonferroni's corrected, p < 0.05) are superimposed on the segmented and inflated left and right hemispheres of one of the participants. Motor areas include left M1 and right cerebellum (not shown in the figure). Change areas include left and right PRR, left and right aIPS, left and right mIPS, and left and right PMd. White dotted lines mark the central sulcus (CS) and the intraparietal sulcus (IPS). corr., Corrected.
