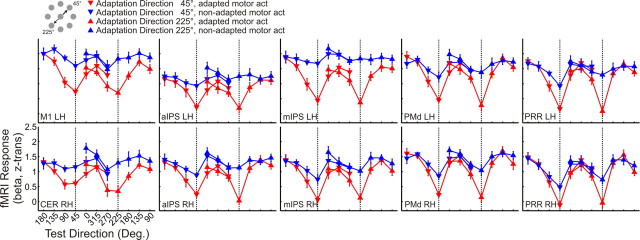
Figure 5.
BOLD response (reported as z-transformed β weights) in each ROI in experiment 1. The pattern of the BOLD response in adapted (red curve) and non-adapted (blue curve) motor act test trials is plotted as a function of the test direction, separately for adaptation direction 45° (downward triangles) and 225° (upward triangles). Adaptation directions 45° and 225° are indicated by vertical dotted lines. Data are averaged across individually extracted z-transformed β values from n = 13 participants. Error bars indicate ±SEM. Labels are the same as in Table 1. Deg., Degrees.

