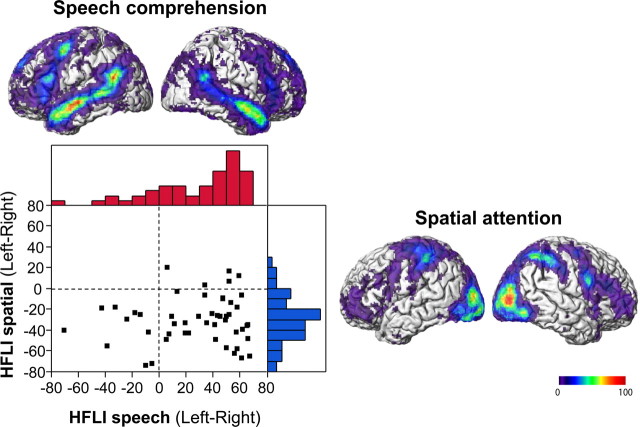
Figure 1.
Probabilistic maps of the 5000 most activated voxels during the language (top) and spatial attention tasks (right), and HFLI distribution in 49 right-handers. The activation probabilistic maps are superimposed on a single subject included in the template of 80 subjects used for spatial normalization. The red and blue histograms are language and spatial attention HFLI distributions, respectively.

