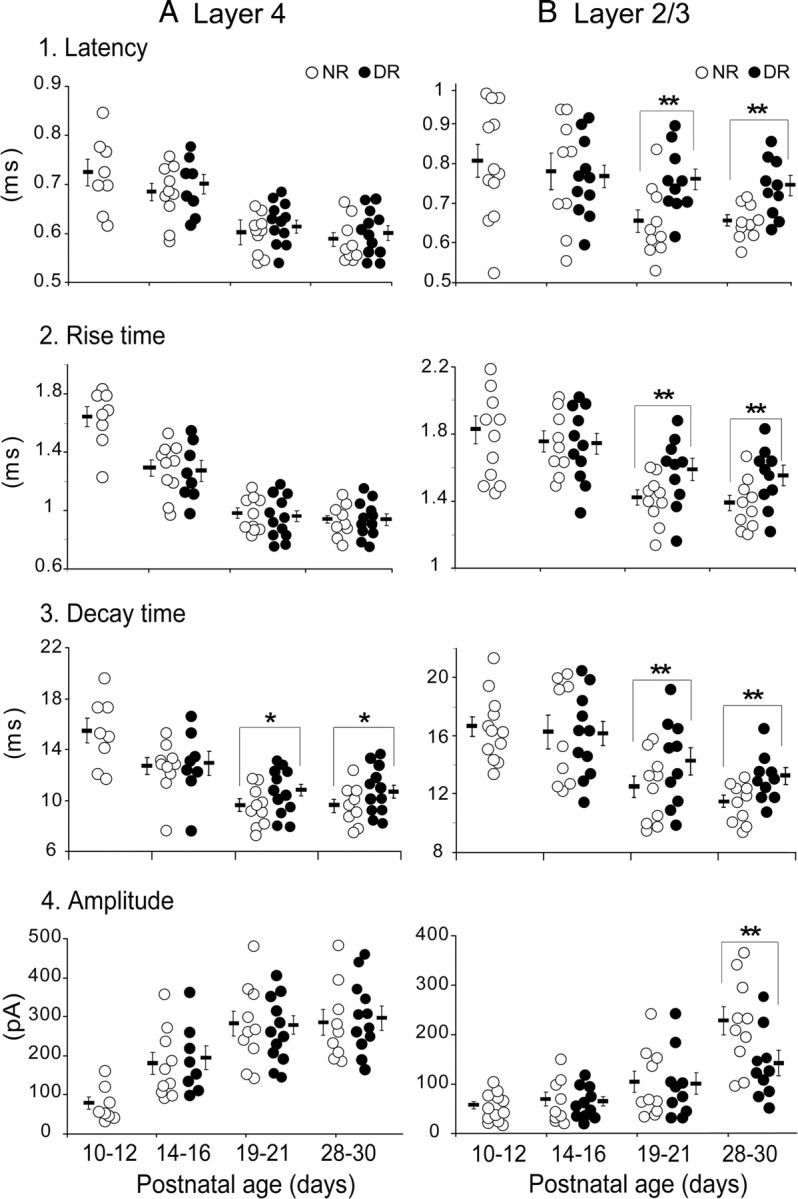
Figure 5.

Effects of age and visual deprivation on strength and dynamics of uIPSCs of principal cells evoked by action potentials of FS-GABA neurons. A1, B1, Latency of uIPSCs of each of the star pyramidal cells in layer 4 (A1) and pyramidal cells in layer 2/3 (B1) in the age group indicated at the bottom of each column. Open and filled circles indicate values of each cell recorded from normally reared and dark-reared mice, respectively. Short horizontal and thin vertical bars indicate the mean and SEM of each age group. *p < 0.05; **p < 0.01. A2, B2, Rise time of uIPSCs of each cell in layer 4 (A2) and layer 2/3 (B2). A3, B3, Decay time of uIPSCs of each cell in layer 4 (A3) and layer 2/3 (B3). A4, B4, Peak amplitude of uIPSC of each cell in layer 4 (A4) and layer 2/3 (B4). The age groups shown at the bottom of A4 and B4 apply to all graphs.
