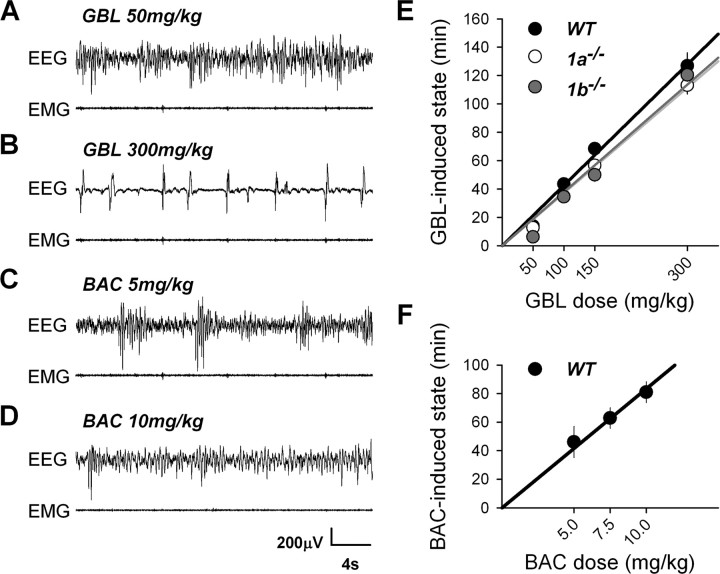
Figure 4.
A–D, Representative traces illustrating the effects of GBL and BAC on the EEG and EMG in WT animals after 50 (A) and 300 (B) mg/kg of GBL and after 5 (C) and 10 (D) mg/kg of BAC. Similar EEG and EMG patterns after GBL were found in 1a−/− and 1b−/− mice. GBL did not affect behavior or EEG in 1−/− or 2−/− mice (data not shown). E, Length of GBL-induced state in 1a−/−, 1b−/−, and WT mice. The length of GBL-induced state increased linearly and dose-dependently (linear regression; WT, n = 8, R2 = 0.99; 1a−/−, n = 8, R2 = 0.99; 1b−/−, n = 9, R2 = 0.96). The length of GBL-induced state varied with dose and genotype and was, in general, longer in WT mice (two-way ANOVA, factor genotype, p = 0.0011; factor dose, p < 0.0001; genotype × dose, p = 0.42; genotype, 1a−/− = 1b−/− < WT; Tukey's test, p < 0.05; dose:,50 < 100 < 150 < 300 mg/kg; Tukey's test, p < 0.05). F, Length of BAC-induced state after each dose of BAC in WT mice. The length of BAC-induced state increased linearly and dose-dependently within this dosage range (linear regression, WT, n = 8, R2 = 0.96; one-way ANOVA, factor dose, p = 0.033; 5 = 7.5 < 7.5 = 10 mg/kg; Tukey's test, p < 0.05).

