
Figure 2.
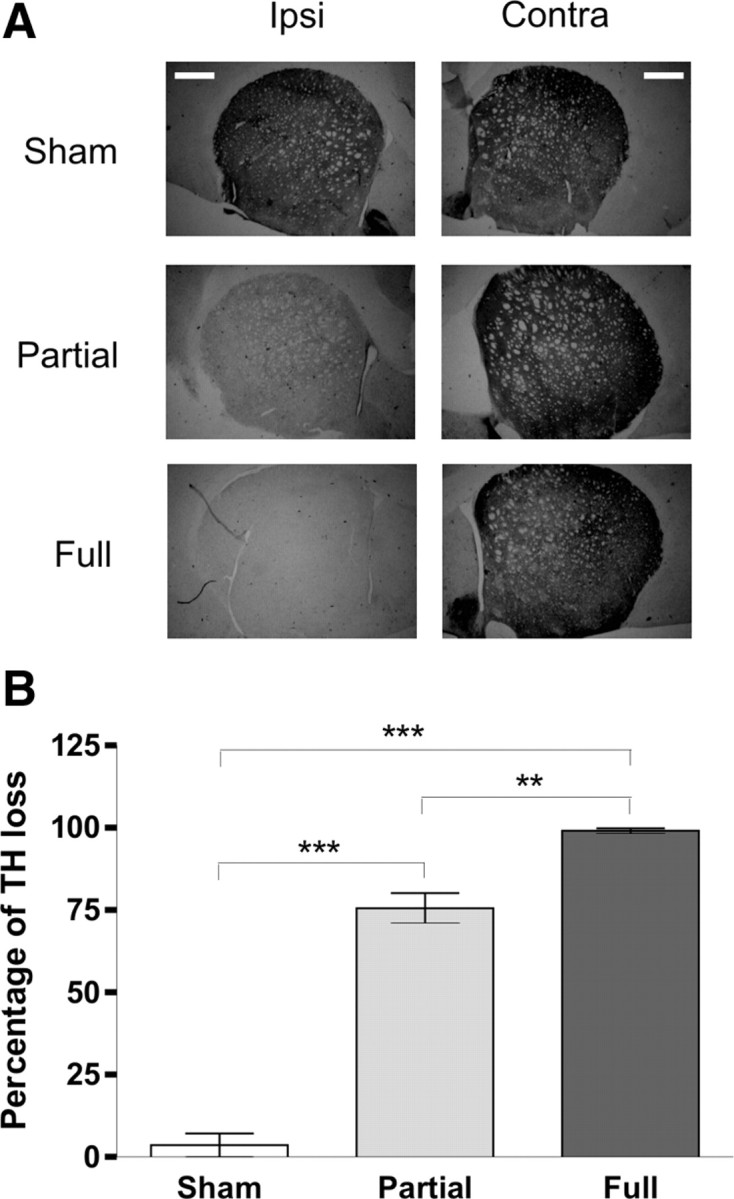
TH immunohistochemistry of the striatum from sham-operated, PL, and FL rats. A, Representative section of TH immunostaining in the striatum of sham-operated, PL, and FL rats. Scale bars, 1 mm. Ipsi, Ipsilateral; Contra, contralateral. B, Percentage of TH optical density loss compared with contralateral side. The measure was made blindly using NIH Image J software. The graph shows highly significant differences between FL (n = 13) and PL (n = 12) versus sham-operated (n = 12) rats. Moreover, significant differences were seen between the PL and FL groups. Values were expressed as the group mean ± SE with **p < 0.01 and ***p < 0.001.