
Figure 4.
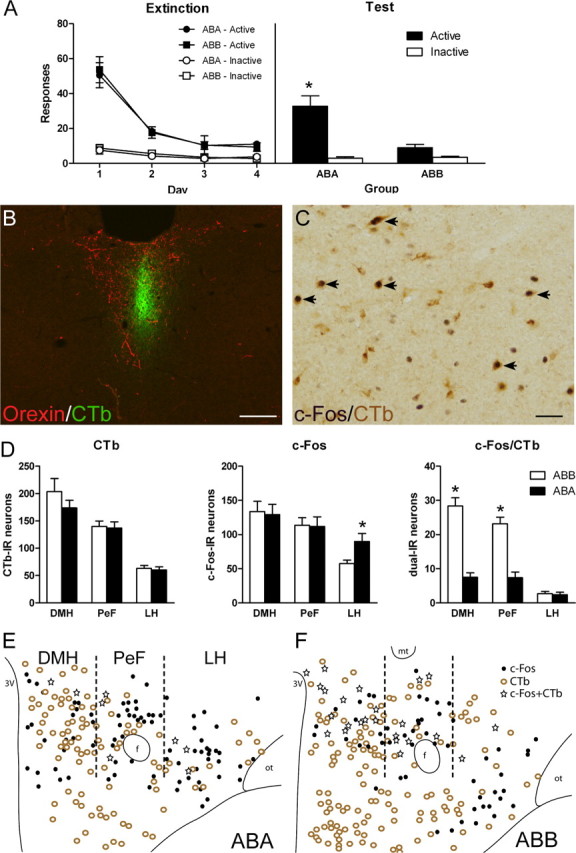
The expression of extinction is associated with activation of MDH projections to PVT. A, Responses on active and inactive nose pokes during extinction (left) or test (right). Rats were trained in context A, extinguished in context B, and then tested in either context A (group ABA) or context B (ABB). Group ABB showed significantly less responding on test than group ABA. B, Representative photomicrograph of PVT CTb injection. Placements were verified with dual immunofluoresence for orexin (red) and CTb (green). Scale bar, 100 μm. C, Representative photomicrograph of immunoreactivity in MDH. Arrows point to neurons dual-IR for CTb and c-Fos. Scale bar, 50 μm. D, Total counts through dorsal hypothalamus of CTb-IR (left), c-Fos-IR (middle), and dual-IR (right). There was no difference between groups in total CTb-IR neurons in DMH, PeF, or LH. There was no difference between groups in total c-Fos-IR in DMH and PeF. Group ABA showed significantly more total c-Fos-IR in LH compared with group ABB. In both DMH and PeF there was significantly more dual-IR neurons in group ABB compared with group ABA. There were no differences between groups in LH. E, F, Representative plots of CTb-IR, c-Fos-IR, and dual-IR distribution throughout dorsal hypothalamus in group ABA (E) and ABB (F). Data are expressed as mean (±SEM). *p < 0.05 comparing group ABB to ABA. f, fornix; mt, mammillothalamic tract; ot, optic tract.