
Figure 8.
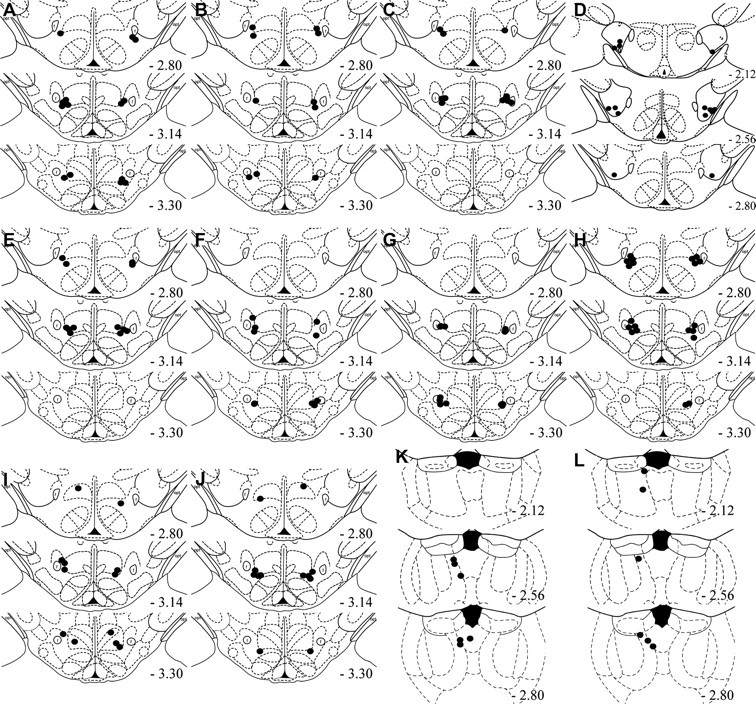
Cannula placement of all microinfusion experiments. Microinfusion cannula placements as verified on Nissl-stained sections for group MDH CART 55-102 tested for extinction (A), MDH vehicle tested for extinction (B), MDH CART 1-27 tested for extinction (C), LH CART 55-102 tested for extinction (D), MDH CART 55-102 untrained (E), MDH CART 55-102 tested for reinstatement (F), MDH vehicle tested for reinstatement (G), MDH CART 55-102 dose–response (H), MDH CART 55-102 trained for sucrose (I), MDH vehicle trained for sucrose (J), PVT U50488 tested for reinstatement (K), PVT vehicle tested for reinstatement (L). The symbols represent the most ventral point of the cannula track for each rat on coronal sections based on the atlas of Paxinos and Watson (1997).