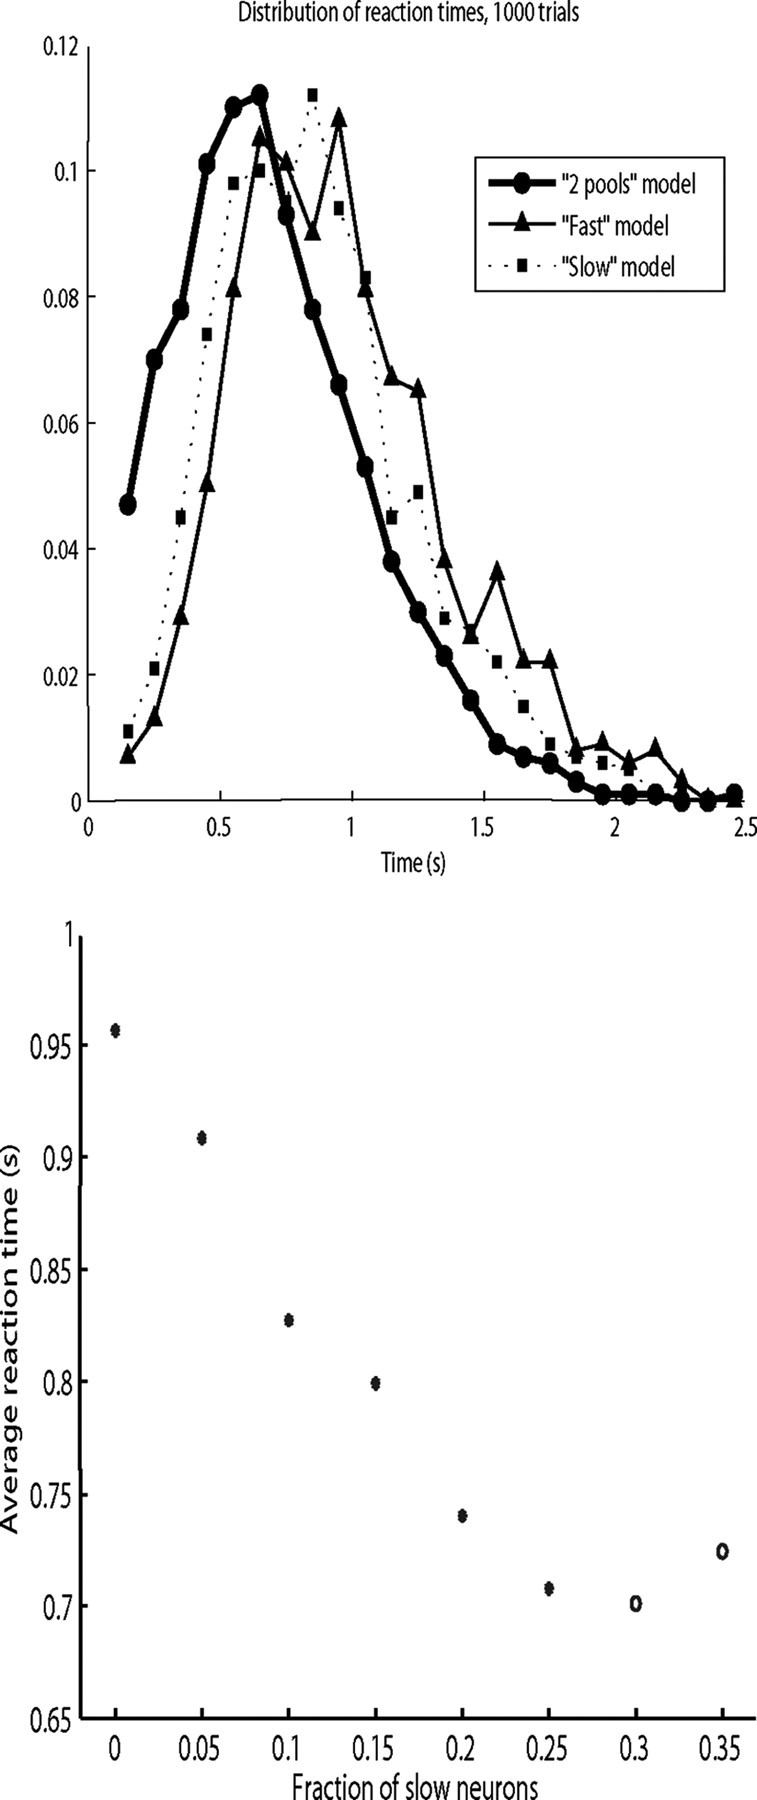
Figure 2.

Top, Distribution of the reaction times for the three different models. The distribution was measured using 1000 trials, and the distribution is shown with 100 ms bins. Circles, two-pool model; triangles, fast model; squares, slow model. Bottom, Two-pool model average reaction time as a function of the fraction of slow versus fast neurons in the inhibitory pool. Open circles mark the cases where the spontaneous state is unstable, i.e., the values for which >50% of the trials showed a transition to the decision state before the decision cues are applied. The point for a fraction = 0 corresponds to the fast or original model. The point for a fraction = 0.25 corresponds to the two-pool model.
