Figure 4.

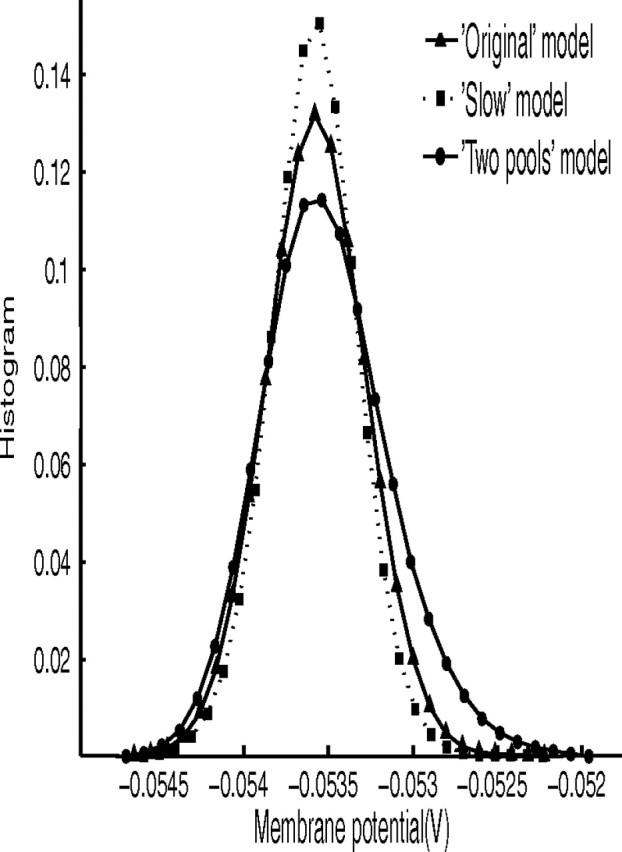
Distribution of average membrane potentials Va values in the specialized winning pool before the cue injection for the three models, using 30 bins. Triangles, fast model; squares, slow model; circles, two-pool model.

Distribution of average membrane potentials Va values in the specialized winning pool before the cue injection for the three models, using 30 bins. Triangles, fast model; squares, slow model; circles, two-pool model.