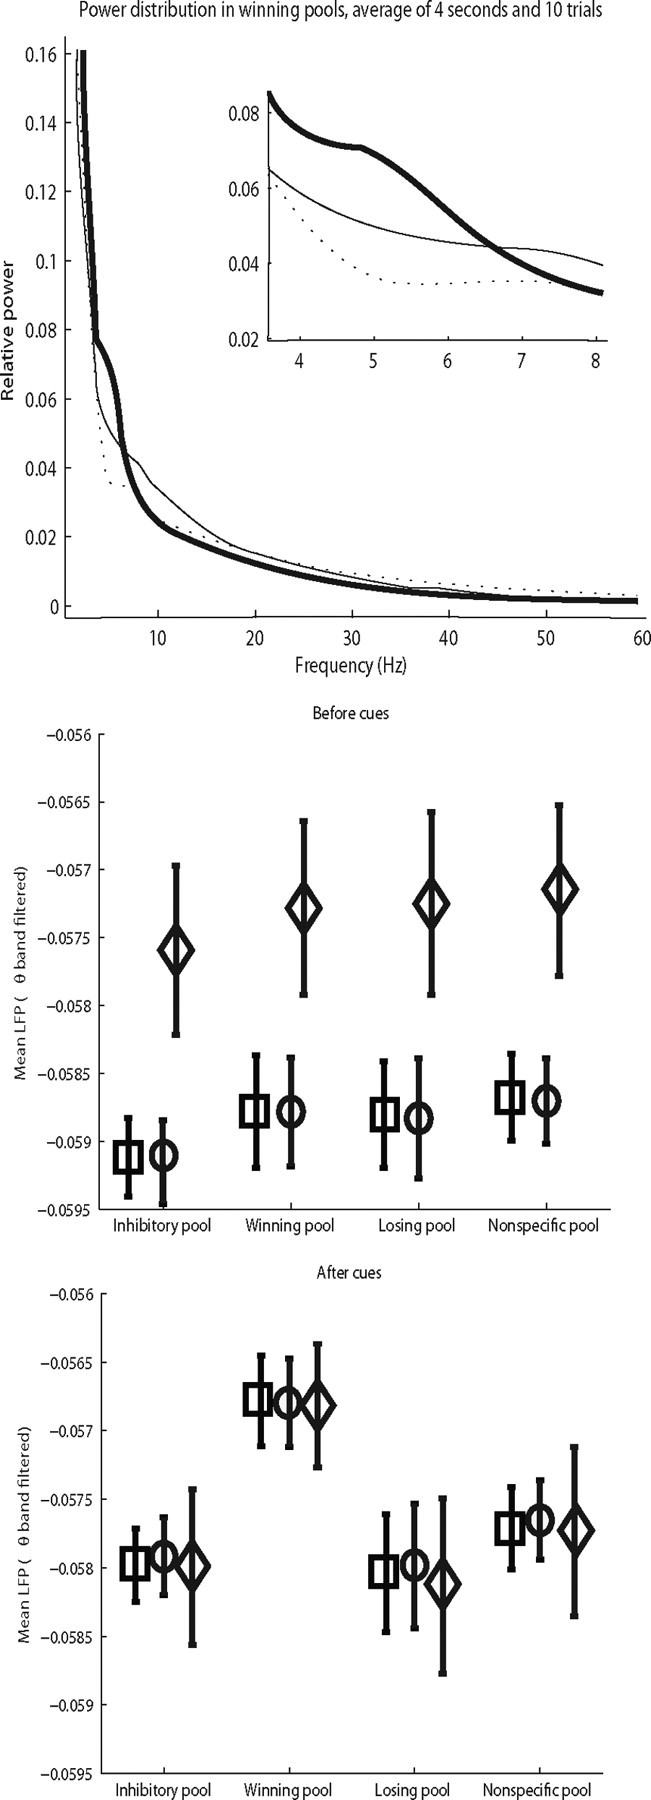
Figure 5.

Top, Power spectra as calculated from the continuous wavelet transform of the average membrane potential over the 1.5–100 Hz range. Inset, Detail of the spectra for the 4–8 Hz region. Individual spectra were taken by squaring and normalizing the CWT coefficients for each time point, then averaging the result over the whole 4 s of simulation. Data shown in the plot are the average of 10 such spectra for each model. Dotted line, fast model; thin line, slow model; thick line, two-pool model. Middle and bottom, Mean values and SDs of the theta-filtered average membrane potentials Va, before (middle) and after (bottom) the cue injection for all pools and for the three models. The values reported are the average across 200 trials for each model. Circles, fast model; squares, slow model; diamonds, two-pool model.
