
Figure 5.
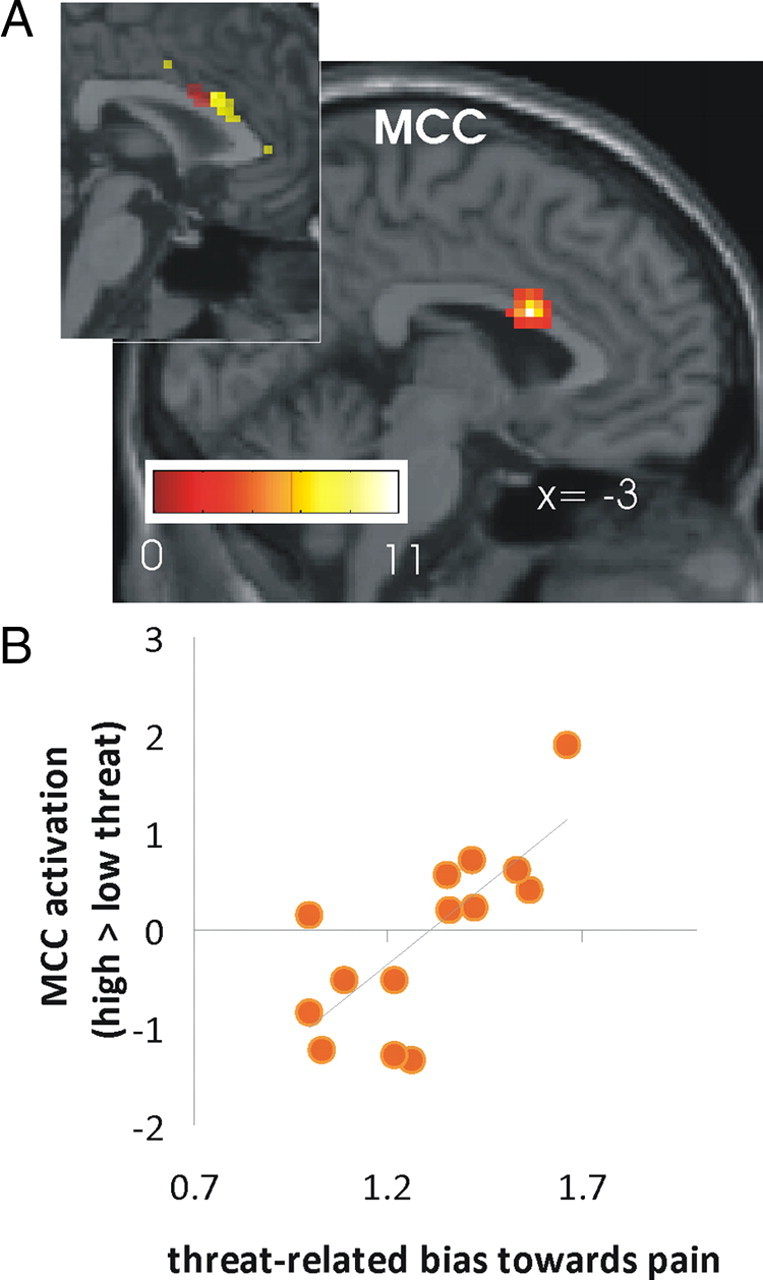
Second-level analysis showing a positive correlation between the threat-related bias toward pain and brain activation in high threat vs low threat trials during stimulation. A, The simple linear regression analysis showed a positive correlation in the MCC between the bias index used (number of pain decisions in high threat trials divided by number of pain decisions in low threat trials) and contrast maps for high > low threat during stimulation. As shown in the insert this MCC activation cluster overlapped with the cluster showing heightened connectivity with the anterior insula during anticipation as revealed by PPI analyses (shown in yellow). B, Scatterplot of the bias index and parameter estimates of the MCC in the simple regression analysis. Note that on the x-axis, 1 indicates an equal amount of decisions for pain in the high threat and low threat condition (i.e., no bias).