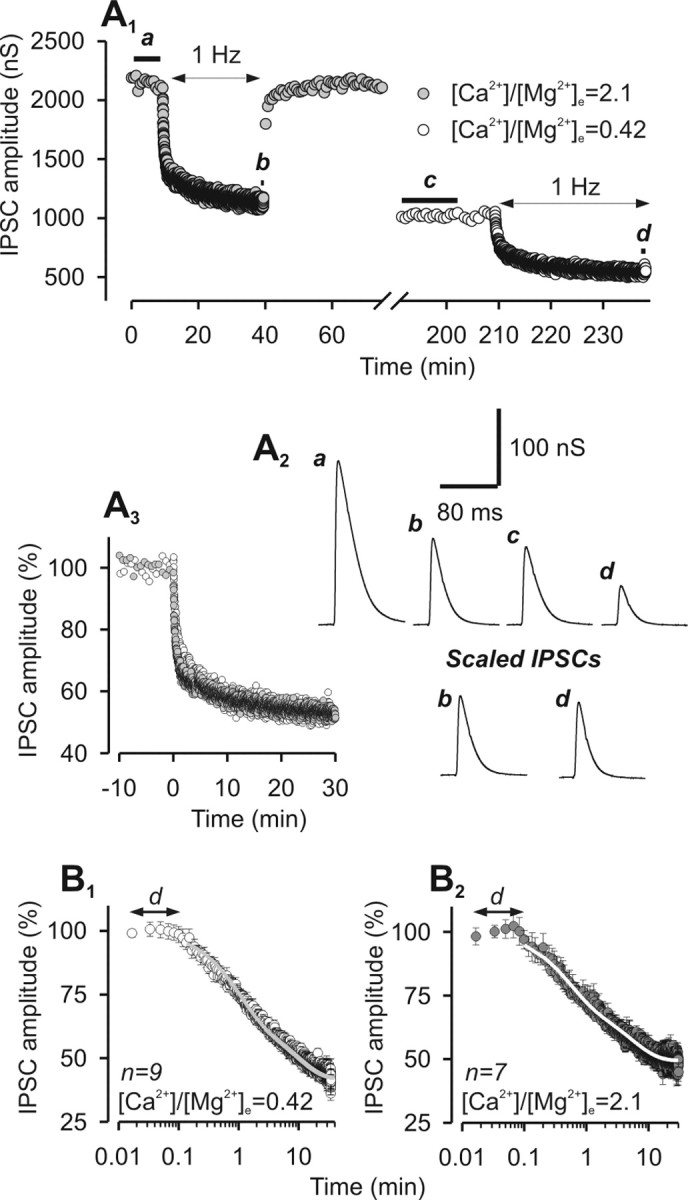
Figure 1.

Time course and plateau of LFD are independent of the initial release probability. A1, Representative experiment of IPSC amplitude plotted against time before and after the induction of LFD at high and low [Ca2+]/[Mg2+]e. A2, Top traces (a–d), Average traces of at least 10 successive IPSCs recorded during the corresponding period indicated by thick horizontal lines on A1. Bottom traces, Traces b and d corresponding to the plateau of LFD at high and low [Ca2+]/[Mg2+]e, respectively, were normalized with respect to the mean value of IPSCs recorded during the plateau at 0.025 Hz. A3, Superimposition of normalized IPSCs amplitude during LFD monitored at low and high Ca2+-containing medium (same symbols as in A1). IPSC amplitudes were normalized with respect to the mean IPSC value recorded during the plateau at 0.025 Hz. Time 0 denotes the start of 1 Hz stimulation. B, Time course of LFD at low (B1) and high (B2) Ca2+-containing medium was determined by averaging normalized IPSCs from n experiments as indicated on the graphs. The solid gray and white lines represent the biexponential decay curves fitted to the data. The duration of the delay (d) before the actual induction of depression is represented by the black arrows. Error bars indicate SEM.
