Figure 3.

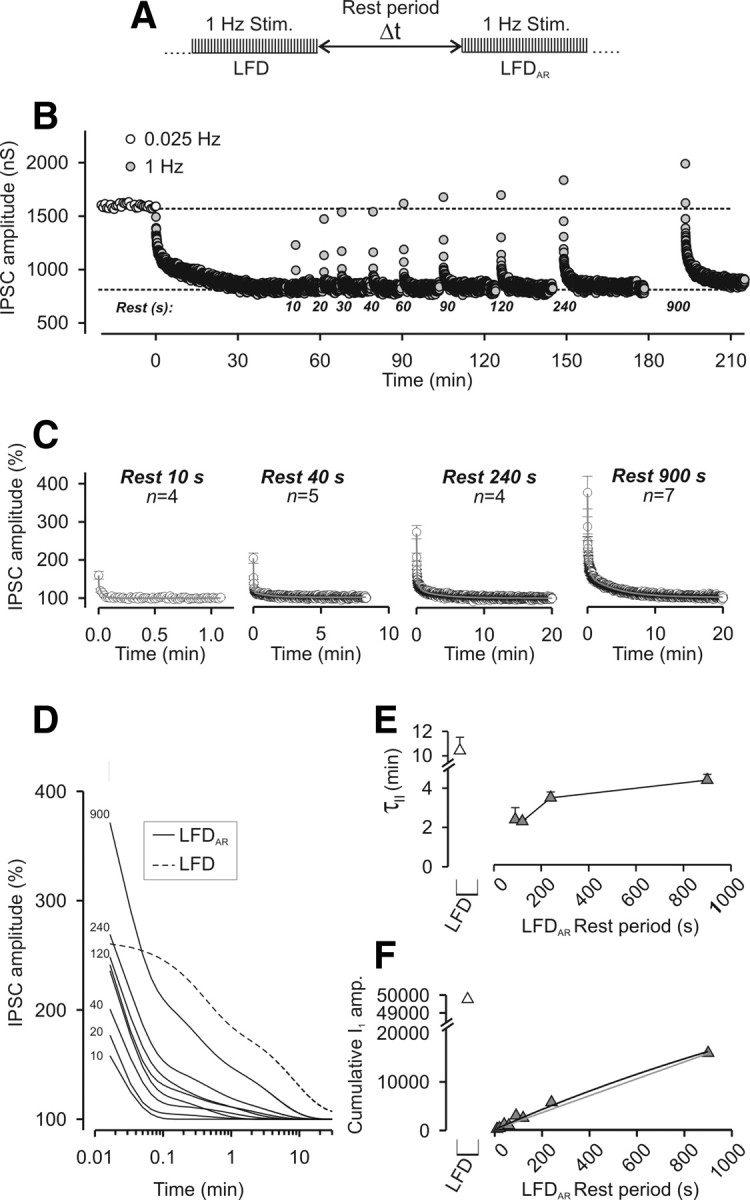
Recovery from LFD after variable rest periods. A, Paradigm of stimulation used to elicit LFDAR. B, Typical experiment performed at the same synapse during which LFDAR was probed after different duration of the rest periods. Time 0 denotes the start of 1 Hz stimulation. Note that the plateaus of LFD and LFDAR are identical. C, The time course of LFDAR was determined by averaging IPSCs at any stimulus from n experiments as indicated on the graphs. The solid gray lines represent the exponential decay curves fitted to the data. Only four representative rest periods are shown. D, Superimposition of the fitted decay curves to the data obtained for all the tested rest periods. The number indicated on the left of curves corresponds to the respective duration of the rest period. For C and D, IPSC amplitudes were normalized to the average IPSC amplitude determined during the plateau of LFD. E, The slowest time constants (τII) of LFDAR (gray-filled triangles) that were obtained by fitting mean amplitude values of IPSC (Table 1) were plotted against the length of the rest periods and compared with the slowest time constant of LFD (open triangle). F, Cumulative plots of IPSC amplitude were calculated from the fits obtained in D over a period of 30 min (same symbols as in E). Error bars indicate SEM.
