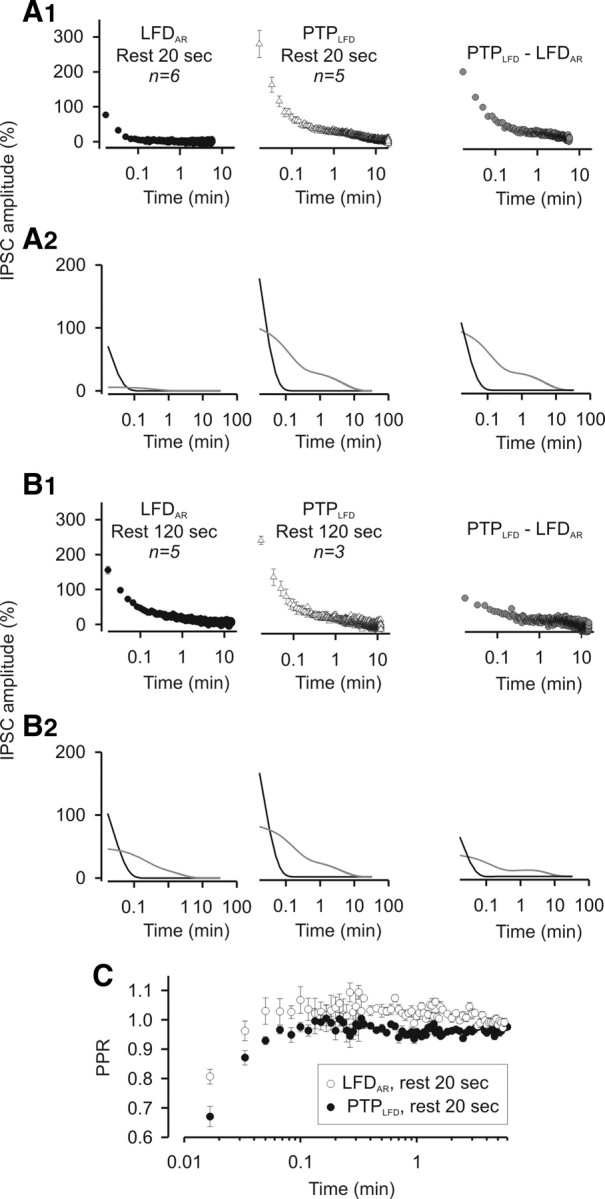
Figure 7.

High-frequency stimulations accelerate the reactivation of the same population of release sites that were reactivated during period of inactivity. A1, Left and middle, Mean values of IPSCs recorded during LFDAR and PTPLFD after a rest period of 20 s. Each point corresponds to the mean value of n experiments as indicated on the graphs. Right, Subtraction of the mean values of IPSCs recorded during LFDAR after a rest period of 20 s from the corresponding IPSCs (i.e., at the same stimulus number) recorded during PTPLFD after a rest period of 20 s. A2, The time courses of LFRAR, PTPLFD, and the difference between PTPLFD and LFRAR could be fitted by a triexponential decay curve, which can be decomposed into a monoexponential decay with a fast component (0.9 s < τfast < 1.7 s; black lines) and a biexponential decay with time constants τI and τII close to the ones found in LFD (gray lines). B, Same measurements as in A, but for a rest period of 120 s. C, Superimposition of the mean values of PPR calculated for each stimulus during PTPLFD and during LFDAR after a rest period of 20 s. For A1 and B1, IPSC amplitudes were normalized to the average IPSC amplitude determined during the plateau of LFD. Error bars indicate SEM.
