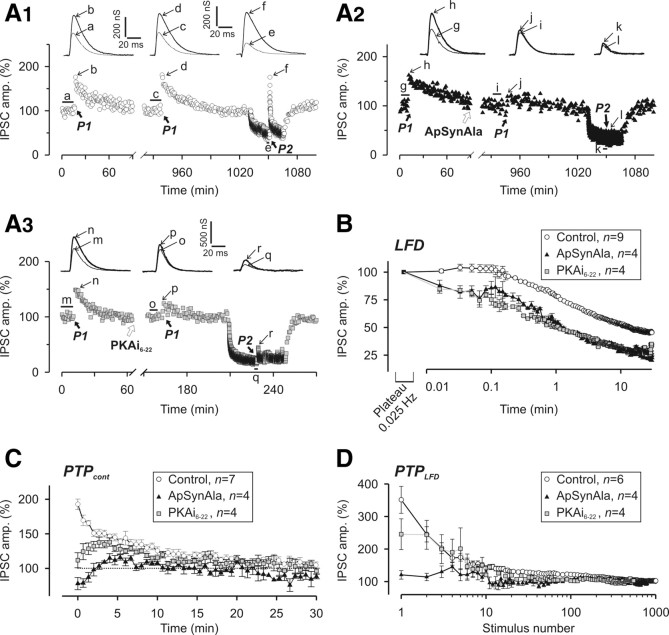
Figure 8.
Phosphorylation of synapsin at P-site 1 by PKA is involved in LFD, PTPcont, and PTPLFD. A1, A2, Representative experiment from a series of three during which PTPcont (paradigm P1) (Fig. 6A) and PTPLFD (paradigm P2) (Fig. 6A) (rest period of 20 s) were elicited in a mock-injected presynaptic neuron (A1) or in a neuron injected with ApSynAla (A2). Conditioning trains were applied at times indicated by the thick black arrows. A3, PTPcont and PTPLFD probed before and after microinjection of PKAi6-22, an inhibitor of PKA. ApSynAla (A2) and PKAi6-22 (A3) were injected at the time indicated by the white arrows. Traces a, c, e, g, i, k, m, o, and q correspond to the mean traces of at least 10 successive IPSCs recorded before the conditioning train as indicated by the thick horizontal black lines, whereas traces b, d, f, h, j, l, n, p, and r were recorded at the peak of PTPcont or PTPLFD as indicated by the thin black arrows. B, Phosphorylation of synapsin at P-site 1 by PKA is involved in LFD. Comparison of the time course of LFD (mean values of IPSCs from n experiments as indicated on the graph) elicited in control condition (open circles, same values as in Fig. 1B1) and neurons injected with either ApSynAla (black-filled triangles) or PKAi6-22 (gray-filled squares), respectively. C, D, Changes in IPSC amplitude during PTPcont (C) and PTPLFD probed after a rest period of 20 s (D). PTP was determined in control neurons (open circles) and in neurons injected with either ApSynAla (black-filled triangles) or PKAi6-22 (gray-filled squares). Each point corresponds to mean values of IPSCs from n experiments as indicated on the graphs. Note that intracellular injections of ApSynAla and PKAi6-22 greatly altered the PTPcont and PTPLFD. For A–C, IPSC amplitudes were normalized to the average IPSC amplitude determined during the plateau at 0.025 Hz. For D, IPSC amplitudes were normalized to the average IPSC amplitude determined during the plateau of LFD. Error bars indicate SEM.

