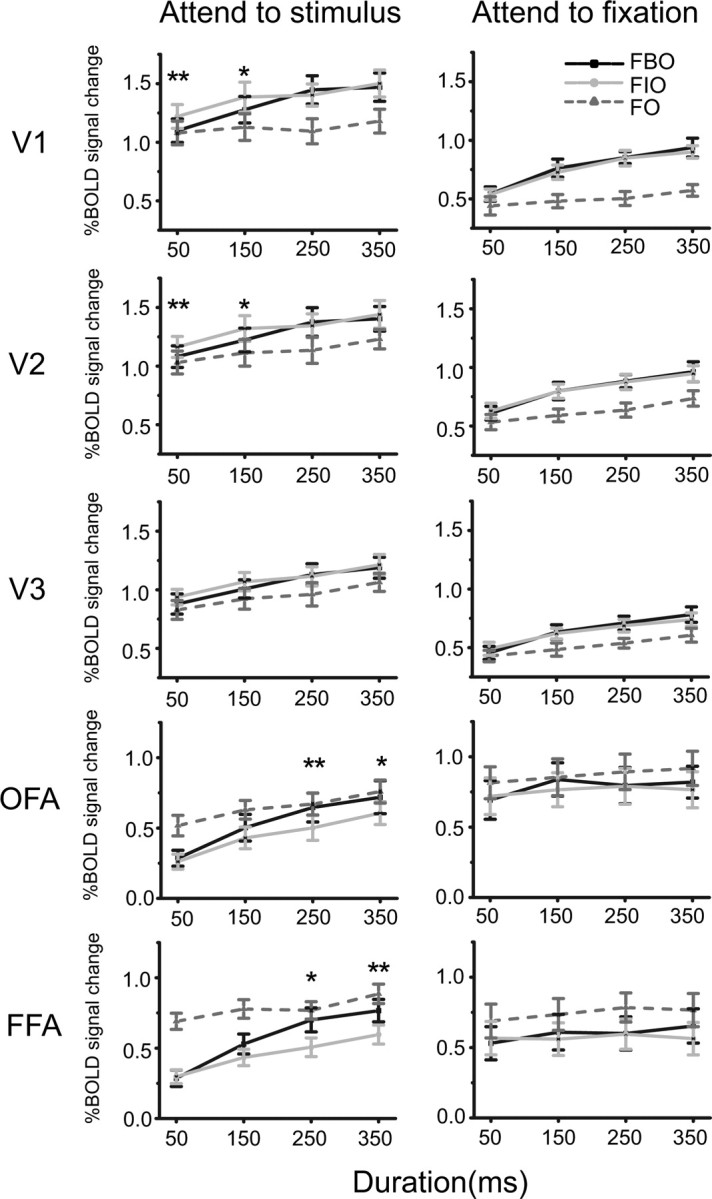
Figure 3.

Results in the first (left column) and the second (right column) fMRI experiments. For each cortical area, BOLD responses to FIO, FBO, and FO stimuli were plotted as a function of stimulus duration. Asterisks indicate a statistically significant difference between BOLD responses to FBO and FIO stimuli (*p < 0.05, **p < 0.01). Error bars denote 1 SEM calculated across subjects for each condition.
