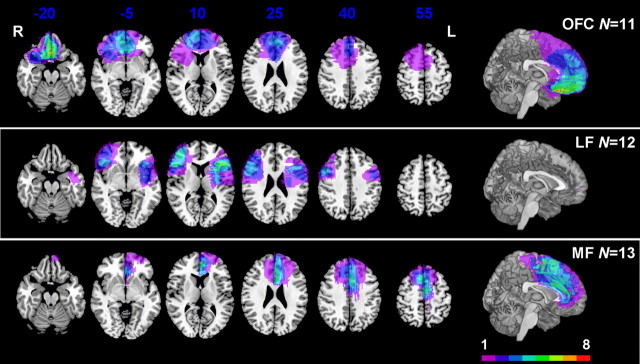
Figure 2.
Representative axial slices and midsagittal views of the MNI brain, showing the degree of lesion overlap for subjects with damage affecting OFC (OFC group, n = 11; top row) and those without damage to this region, divided into those with lesions involving lateral prefrontal cortex (LF group, n = 12; second row) or the medial surface of the prefrontal cortex (MF group, n = 13; bottom row). Colors indicate the degree of overlap across subjects, as shown in the legend. L, Left; R, right.

