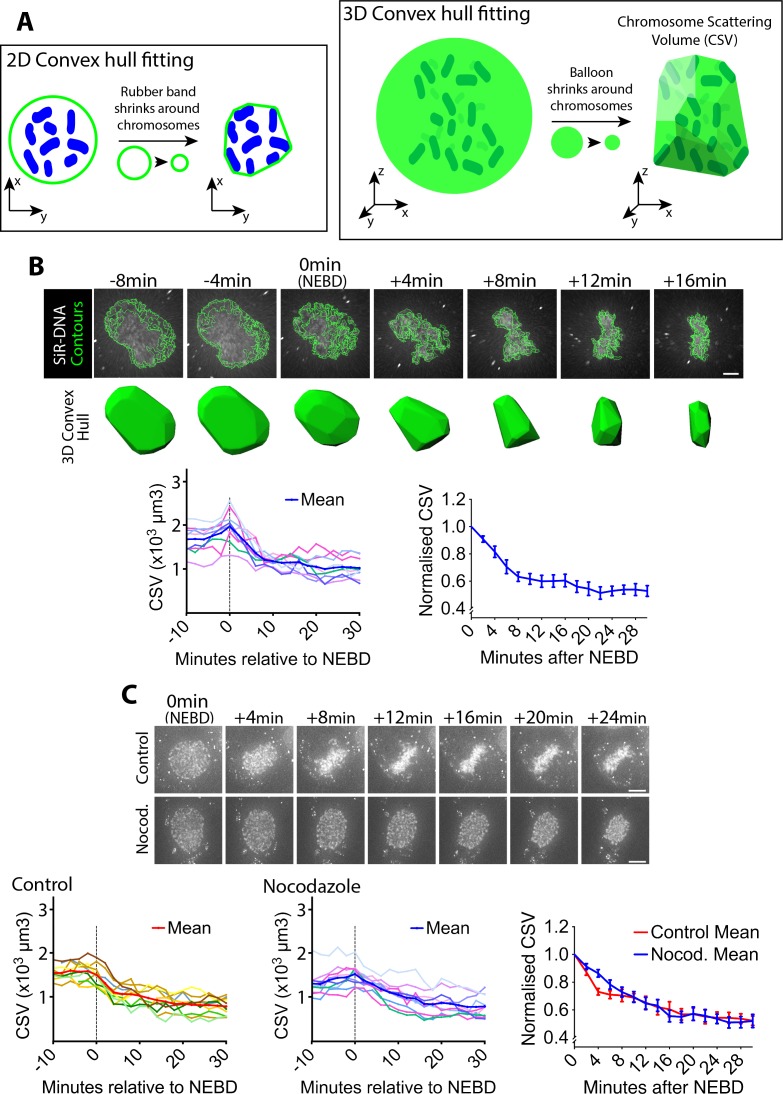
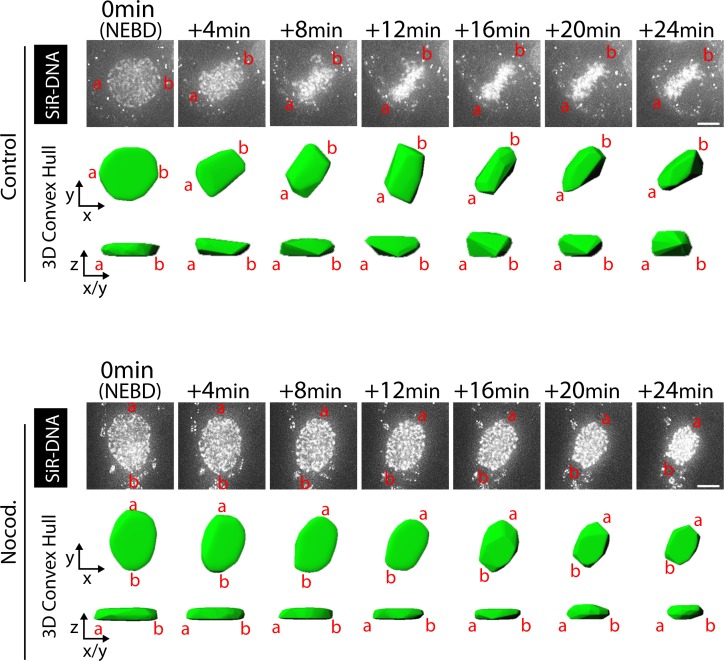
Figure 1. Chromosome scattering volume is reduced in early prometaphase, independently of spindle MTs.
(A) Diagrams show how the chromosome scattering volume (CSV) was defined. Left-hand diagram shows how the convex hull was generated in two dimensions (2D) to represent chromosome distribution. A ‘rubber band’ (green) shrinks around chromosomes (blue) in 2D to create a convex hull or a minimum polygon wrapping chromosomes. Right-hand diagram shows how the convex-hull was generated in three dimensions (3D) to represent chromosome distribution. A ‘balloon’ (green) shrinks around chromosomes (dark green) in 3D to create a convex hull or a minimal polyhedron wrapping chromosomes. The volume of the 3D convex hull (chromosome scattering volume; CSV) quantifies how widely chromosomes are scattered in space. (B) CSV decreases immediately after NEBD. Images (top) are z-projections (z-sections are projected to 2D images) of a representative cell stained with SiR-DNA to visualize chromosomes (white) alongside their perimeter contours at z-sections (green lines; see Materials and methods). Time is shown, relative to NEBD. Timing of NEBD was determined by observation that GFP-LacI-NLS spread out of the nucleus (Figure 1—figure supplement 1). Scale bars, 6 µm. Bottom shows corresponding CSV (green). The left-hand graph shows CSV measurements in individual cells aligned by the time relative to NEBD (n = 9). To make the right-hand graph, these CSV values were normalized to the CSV value at NEBD in each cell, and the mean of the normalized CSV values were plotted at each time point. Error bars, s.e.m. (C) CSV decreases after NEBD even in the absence of MTs. Images (z-projections) show representative cell with SiR-DNA-stained chromosomes, which entered mitosis in the presence of 3.3 µM nocodazole (Nocod., bottom) or DMSO (control, top). 0.5 µM MK-1775 Wee1 inhibitor was used in both conditions to allow cells to enter mitosis. Time is shown relative to NEBD. Timing of NEBD was determined by observation that GFP-LacI-NLS spread out of the nucleus (Figure 1—figure supplement 1). Scale bars, 10 µm. Left-hand and center graphs show CSV measurements in individual control and nocodazole-treated cells, respectively (n = 10 each). The right-hand graph compares the means of normalized CSV between the nocodazole-treated and control cells (error bars, s.e.m.), as in the right-hand graph in (B). Reduction of normalized CSV was not significantly different between control and nocodazole treatment, when all the time points were considered by two-way ANOVA (p=0.81). Nonetheless, normalized CSV was significantly different between the two groups at +4 min (t-test, p=0.0016), but not at other time points.
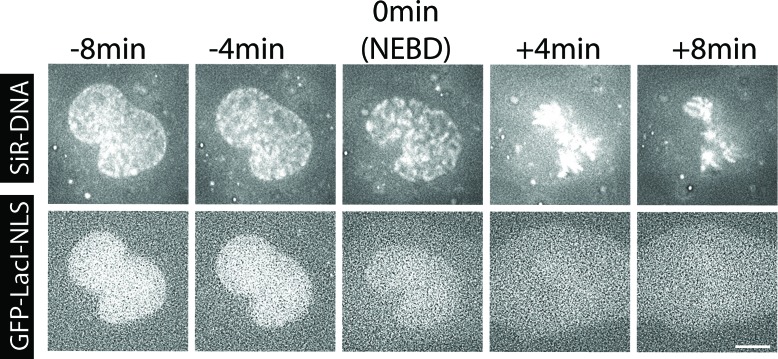
Figure 1—figure supplement 1. Method for estimation of the NEBD timing.
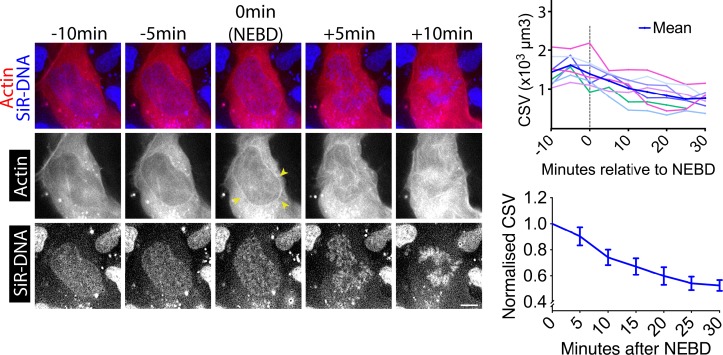
Figure 1—figure supplement 2. CSV decreases and actin accumulates on the NE around NEBD in asynchronous wild-type U2OS cells (without cdk1-as).
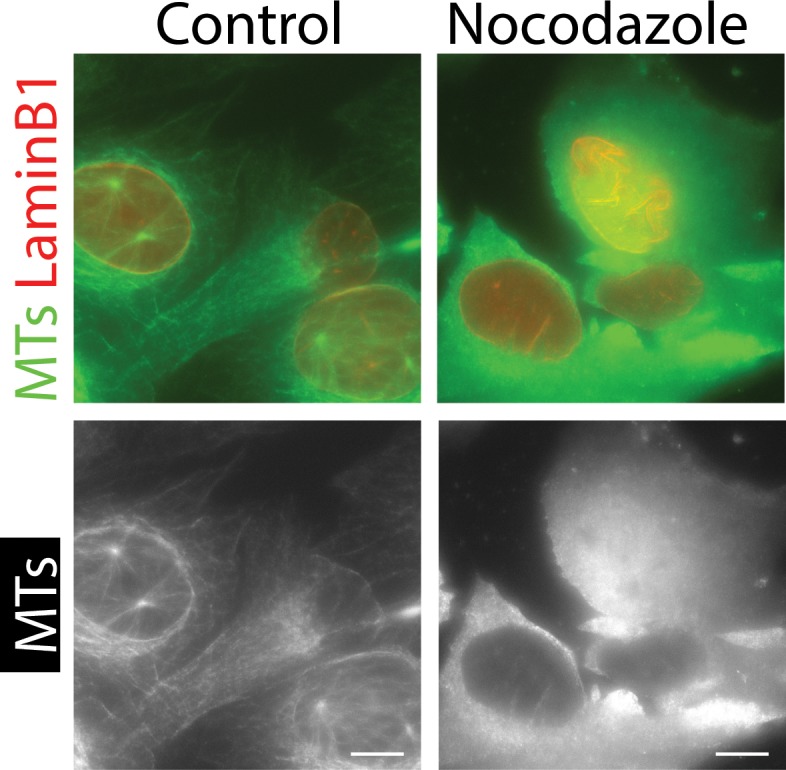
Figure 1—figure supplement 3. Confirmation that MTs are absent after nocodazole treatment.
