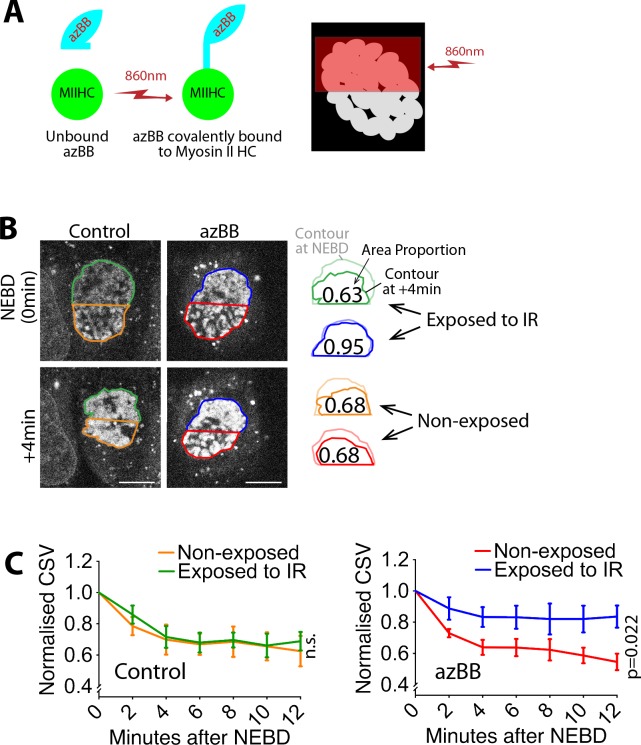
Figure 4. Local inhibition of myosin II activity results in local alleviation of CSV reduction.
(A) Diagram shows that azidoblebbistatin (azBB) is covalently linked to the myosin II heavy chain and inhibits its activity in the half of the nucleus exposed to infrared light. (B) Images (projections of three z-sections) show SiR-DNA-stained chromosomes in representative cells that were incubated in the presence of 5 µM azidoblebbistatin (azBB, right) or DMSO (control, left). The half of the nucleus in blue and green was exposed to 860 nm light just prior to NEBD, while the half in red and orange was not. Time was relative to NEBD. Timing of NEBD was determined by observation that GFP-LacI-NLS spread out of the nucleus (Figure 1—figure supplement 1). Scale bars, 10 µm. Diagrams show how the indicated area was reduced at +4 min, relative to the area at NEBD. (C) Graphs show means of normalized CSV in half of the nucleus, which was exposed vs non-exposed to infra-red (IR), in the presence (bottom) and absence (top) of azBB (control n = 5, azBB n = 7). Colors of lines match the colors that border the half nuclei in D. p-Value (exposed vs non-exposed to IR) was obtained by two-way ANOVA. n.s., not significant. Error bars, s.e.m. CSV was normalized as in Figure 1B.

