
Figure 1. Proteome-wide evolutionary analysis reveals evolutionarily constrained sequence features are widespread in highly diverged intrinsically disordered regions.
(A) Left: Mean versus log variance of the ‘net charge with phosphorylation’ molecular feature for the real Ste50 IDR (a.a. 152–250) ortholog set and simulated Ste50 orthologous IDR sets (N = 1000). Right: Example simulated Ste50 orthologous IDR sets (no. 663 and no. 56 out of 1000) and the real Ste50 IDR and its orthologs, colored according to percent identity in the primary amino acid sequence. (B) Percentage of IDRs that are significantly deviating from simulations in mean, log variance, or both mean and log variance of each molecular feature. (C) Frequency [1 + log(frequency)] of number of significant molecular features per IDR for the real IDRs (yellow) versus the random expectation (blue) obtained from a set of simulated IDRs.

Figure 1—figure supplement 1. Predicted IDRs in the S. cerevisiae proteome (‘IDR’) are more highly diverged compared to regions that are not predicted to be disordered (‘non-IDR’) (p<2.2×10⁻¹⁶, Wilcoxon test).
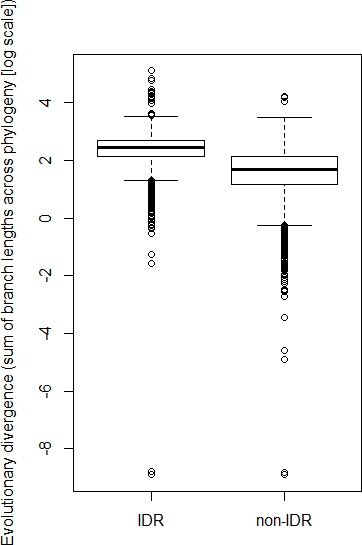
Boxplot boxes represent the 25th-75th percentile of the data, the black line represents the median, and whiskers represent 1.5*the interquartile range. Outliers fall outside the 1.5*interquartile range, and are represented by unfilled circles.
Figure 1—figure supplement 2. Percentage of overlap with Pfam domains for IDRs predicted to be disordered in the S. cerevisiae proteome that are >= 30 amino acids (‘IDR’) have less overlap with Pfam domains compared to all other regions that are >= 30 amino acids (‘non-IDR’) (p<2.2 × 10⁻¹⁶, Wilcoxon test).
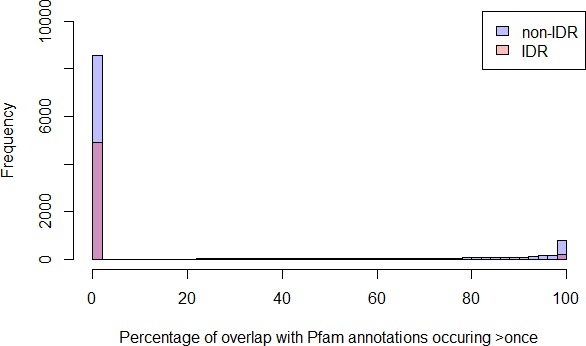
Percentage of regions with 0% Pfam overlap for IDRs is 91%, whereas for non-IDRs it is 74%.