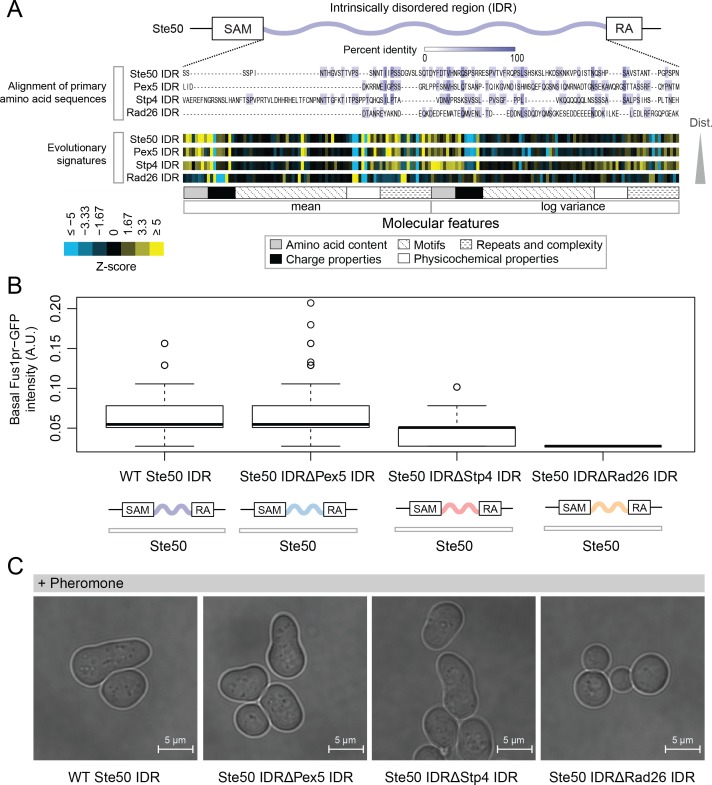
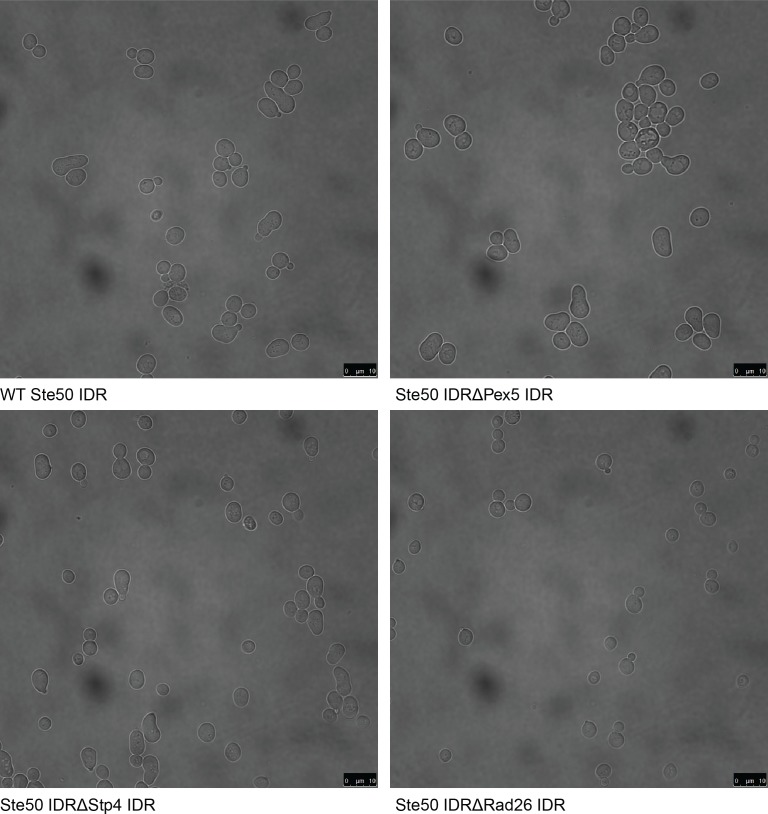
Figure 2. Intrinsically disordered regions with similar evolutionary signatures can rescue wildtype phenotypes, while those with different evolutionary signatures cannot.
(A) Multiple sequence alignment of Ste50 IDR (a.a. 152–250), Pex5 IDR (a.a. 77–161), Stp4 (a.a. 144–256), and Rad26 IDR (a.a. 163–239) shows negligible similarity when their primary amino acid sequences are aligned, while evolutionary signatures show that the Pex5 and Stp4 IDRs are more similar to the Ste50 IDR than the Rad26 IDR. While the Ste50 IDR has five consensus phosphorylation sites that are implicated in its function (Hao et al., 2008; Yamamoto et al., 2010; Zarin et al., 2017), the Pex5 IDR and Rad26 IDR have none, and the Stp4 IDR has 4. IDRs are presented in order of increasing Euclidian distance between their evolutionary signatures, though we do not recommend using this measure to quantitate similarity between evolutionary signatures independently (see Discussion). The Ste50 IDR is located between the Sterile Alpha Motif (SAM) and Ras Association (RA) domains in the Ste50 protein. (B) Boxplots show distribution of values corresponding to basal Fus1pr-GFP activity in an S. cerevisiae strain with the wildtype Ste50 IDR compared to strains with the Pex5, Stp4, or Rad26 IDR swapped to replace the Ste50 IDR in the genome. Boxplot boxes represent the 25th-75th percentile of the data, the black line represents the median, and whiskers represent 1.5*the interquartile range. Outliers fall outside the 1.5*interquartile range, and are represented by unfilled circles. Distribution of GFP activity is based on quantification of GFP intensity in single cells pooled from four colonies (which we define as biological replicates) for each strain; sample sizes for each distribution are as follows: WT n = 588 cells, Pex5 IDR n = 196 cells, Stp4 IDR n = 228 cells, Rad26 IDR n = 271 cells. (C) Brightfield micrographs showing each strain from part B following exposure to pheromone. Shmooing cells are those which have elongated cell shape, representing mating projections.


