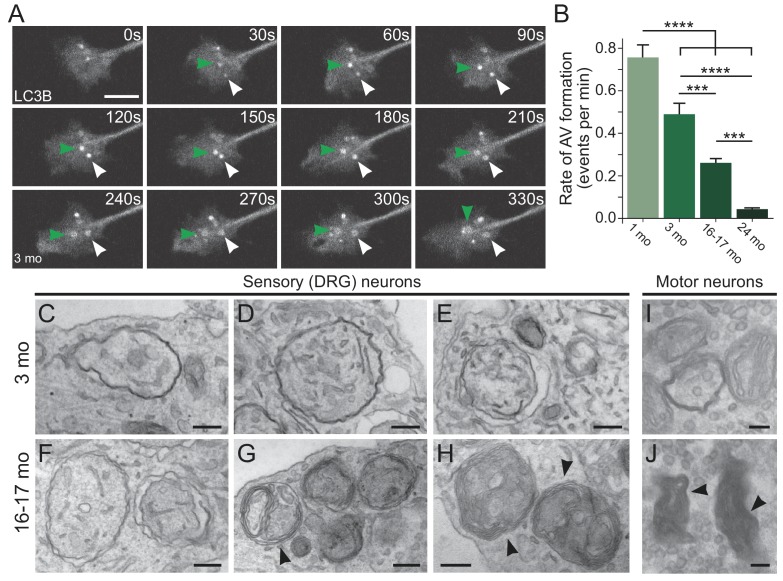
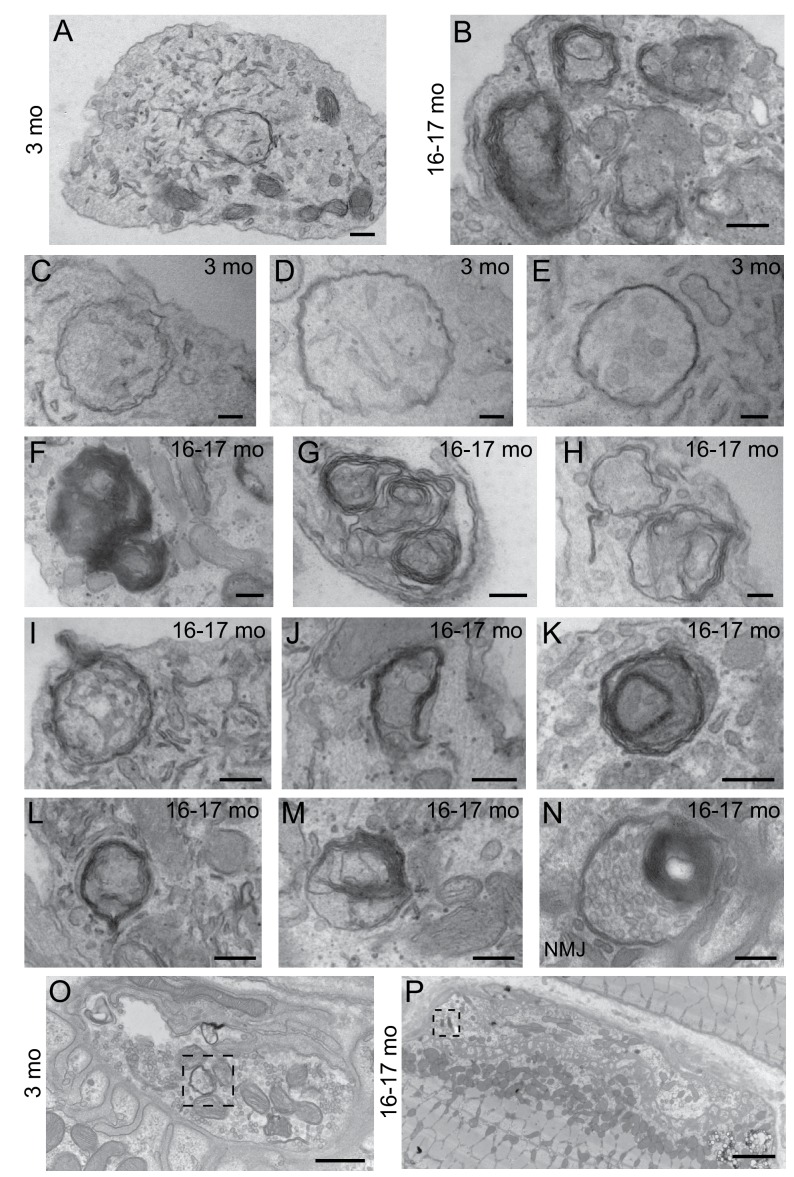
Figure 1. Autophagosome biogenesis decreases with age and results in aberrant AV formation in mammalian neurons.
(A) Time series of GFP-LC3B in the distal axon of a DRG neuron from a young adult mouse. Green and white arrowheads each follow one autophagosome biogenesis event. Retrograde is to the right. Scale bar, 2 μm. (B) Quantification of the rate of autophagic vesicle (AV) biogenesis (assayed by GFP-LC3B puncta formation per minute) in DRG neurons from young (one mo, light green), young adult (three mo, green), aged (16–17 mo, dark green), and advanced aged (24 mo, very dark green) mice (mean ± SEM; n ≥ 54 neurons from three biological replicates). ***p<0.0005; ****p<0.0001 by one-way ANOVA test with Tukey’s multiple comparisons test. (C–E) Representative electron micrographs of autophagosomes in DRG distal tips from young adult mice. AVs are composed of a continuous double membrane enclosing engulfed cytoplasm. Scale bars, 200 nm. (F–H) Representative electron micrographs of autophagosomes in DRG distal tips from aged mice. AVs contain multiple, ruffled double membranes (G, H). Scale bars, 200 nm. (I–J) Electron micrographs of autophagosomes in the presynaptic compartment of neuromuscular junctions (NMJs) from young adult (I) and aged (J) mice. Scale bars, 100 nm. Arrowheads indicate multilamellar membranes in DRGs and NMJs.


