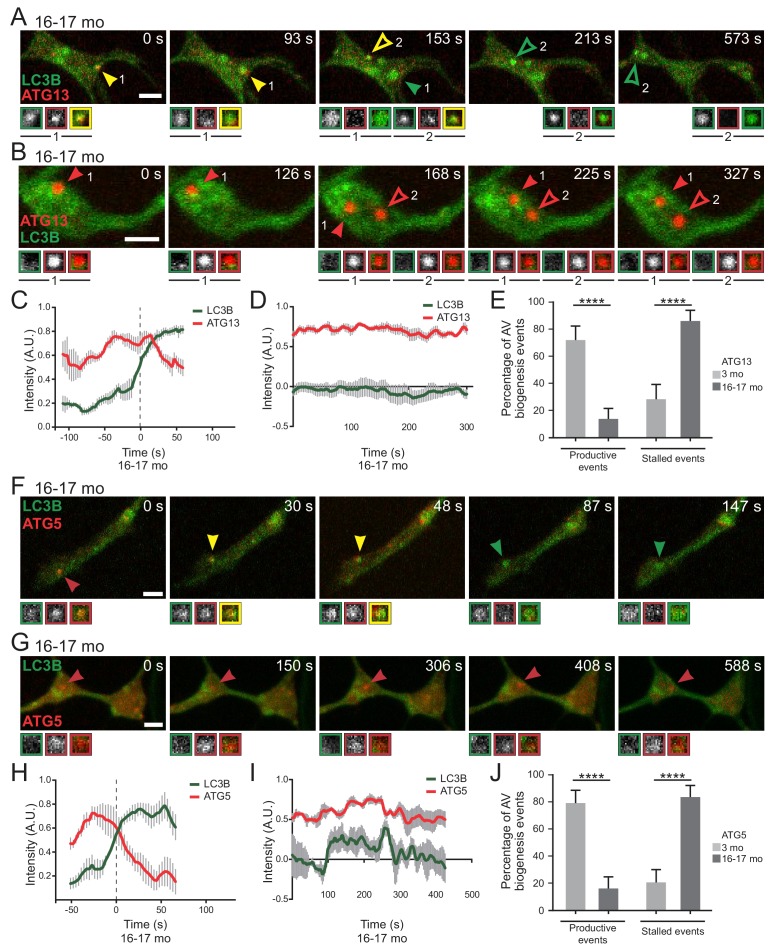
Figure 3. Stalled AVs predominate in neurons from aged mice.
(A–B) Time series of merge micrographs of mCh-ATG13 and GFP-LC3B from live cell imaging of the distal neurite of DRGs from aged mice depicting a productive (A) or a stalled (B) autophagosome biogenesis event. Yellow arrowheads denote colocalization of mCh-ATG13 and GFP-LC3B; green arrowheads denote a GFP-LC3B-positive punctum from which mCh-ATG13 has dissociated; red arrowheads denote mCh-ATG13-positive puncta that fail to recruit GFP-LC3B; solid arrowheads track one punctum, hollow arrowheads follow a second punctum. Magnified views of denoted puncta are shown below full micrograph; border color represents channel or colocalization state in merge. Retrograde is to the right. Scale bars, 2 μm. (C–D) Individual intensity profiles were averaged to improve signal-to-noise of mCh-ATG13 (red) and GFP-LC3B (green) for productive (C) and stalled (D) AVs (mean ± SEM; n ≥ 5 biogenesis events from five neurons from three biological replicates). (E) Quantification of the proportion of total mCh-ATG13-positive AV biogenesis events (both productive and stalled events) in DRG neurons from young adult (light gray) and aged (dark gray) mice (mean ± 95% confidence interval; n ≥ 62 AVs from three biological replicates for each condition). ****p<0.0001 by Fisher’s exact test. (F–G) Time series of merge micrographs of mCh-ATG5 and GFP-LC3B in the distal neurite of DRGs from aged mice depicting a productive (F) or stalled (G) autophagosome biogenesis event. Arrowheads point to puncta magnified below micrograph; colors denote channel or colocalization state in merge. Scale bars, 2 μm. (H–J) Mean intensity profiles of mCh-ATG5 (red) and GFP-LC3B (green) for productive (H) and stalled (I) AVs (mean ± SEM; n = 5 productive biogenesis events from five neurons or n = 4 stalled biogenesis events from four neurons from three biological replicates). Vertical dashed line in (C and H) indicates the half-maximum of GFP-LC3B intensity, which was used to align the traces. (J) Quantification of the proportion of total mCh-ATG5-positive AV biogenesis events (both productive and stalled events) in DRG neurons from young adult and aged mice (mean ± 95% confidence interval; n ≥ 62 AVs from three biological replicates for each condition). ****p<0.0001 by Fisher’s exact test. See also Videos 1–6.


