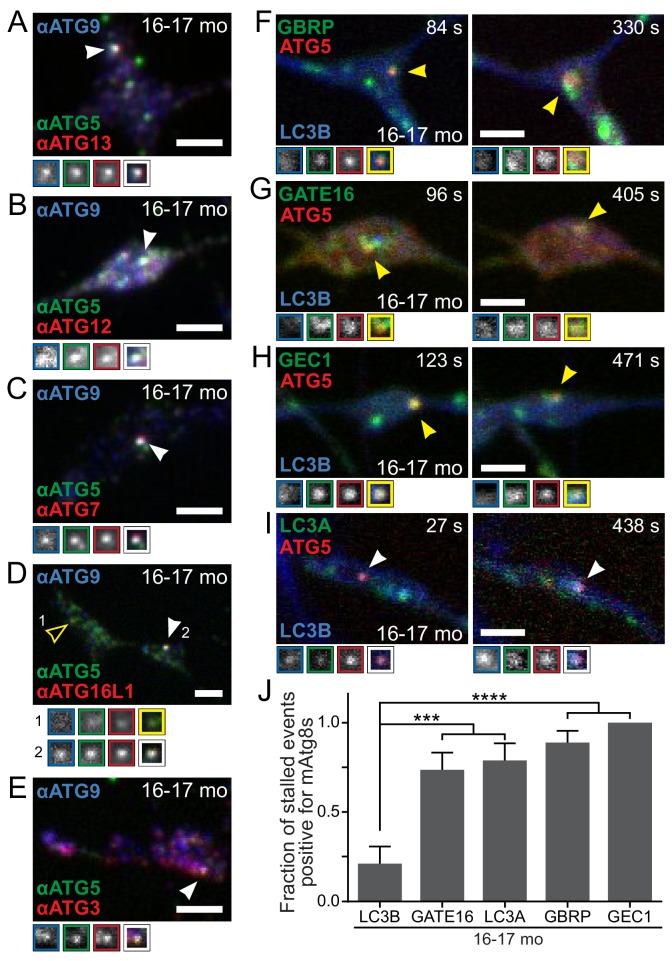
Figure 5. Recruitment of autophagy machinery, including LC3B homologs, to stalled AVs is not sufficient to rescue the biogenesis defect.
(A–E) Representative maximal projection micrographs of the distal neurites of fixed DRG neurons from aged mice. Stalled AVs are identified by colocalization of anti-ATG5 (green) and anti-ATG9 (blue). Antibodies to other autophagy components are visualized in red: ATG13 (A) or elongation complex components ATG12 (B), ATG7 (C), ATG16L1 (D), and ATG3 (E). Arrowheads denote colocalization state of AVs (stalled, filled arrowheads). Borders of magnifications of indicated puncta denote channel or colocalization state in merge. (F–I) Time series (channels merged) of Halo-ATG5, mAtg8s (mCh-GABARAP in F, mCh-GABARAPL2/GATE16 in G, mCh-GABARAPL1/GEC1 in H, and mScarlet-LC3A in I), and GFP-LC3B in the distal neurite of DRG neurons from aged mice depicting stalled AVs. Arrowheads denote colocalization of mAtg8s with stalled AVs. Magnified views of denoted puncta are shown below full micrograph; border color represents channel or colocalization state in merge. Time is indicated as time since stalled AV was first visible. (J) Quantification of the fraction of stalled AVs co-recruiting each LC3/GABARAP family member when individually overexpressed in DRGs from aged mice (mean ± SEM; n ≥ 10 stalled AVs in three biological replicates for each mAtg8). ***p<0.001; ****p<0.0001 by two-tailed Fisher’s exact test. Scale bars, 2 μm.


