. 2019 Jul 16;8:e44907. doi: 10.7554/eLife.44907

Figure 3. Probability distribution functions of swimming speeds for flagellates (a) and ciliates (b) with the fitted log-normal distributions.

Data points represent uncertainties as in Figure 2. Despite the markedly different scales of the distributions, they have similar shapes.

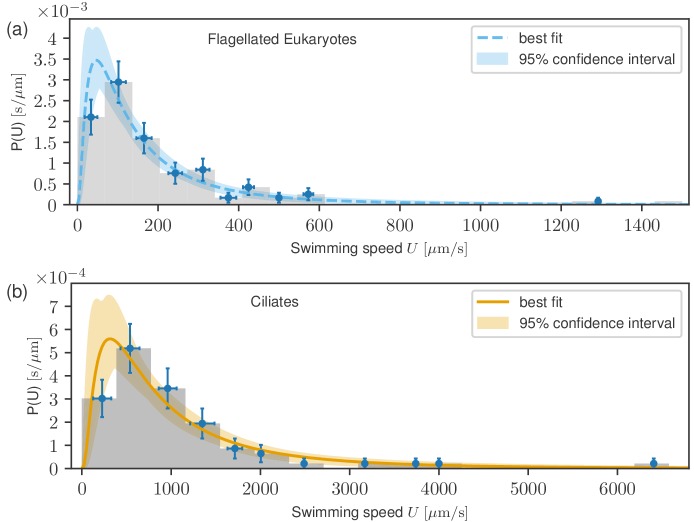
Figure 3.

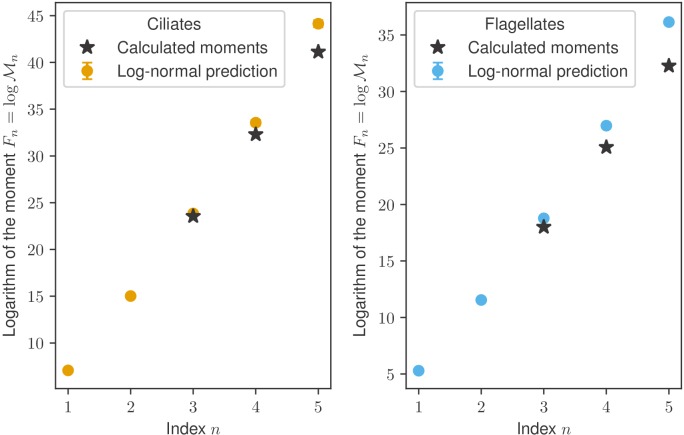
Figure 3—figure supplement 1. Higher moments of the swimming speed distributions obtained from the data compared with those calculated from the fitted log-normal distribution.

Figure 3—figure supplement 1.

The algebraic moments n are defined in Equation (4). Error bars representing 95% confidence intervals for fitted parameters, are obscured by markers.