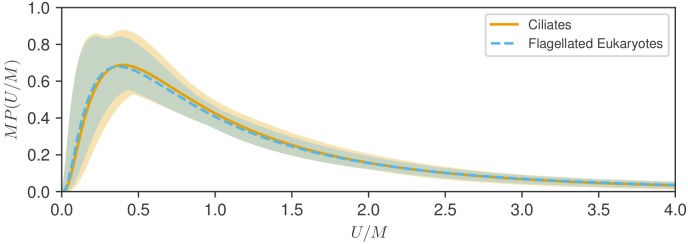
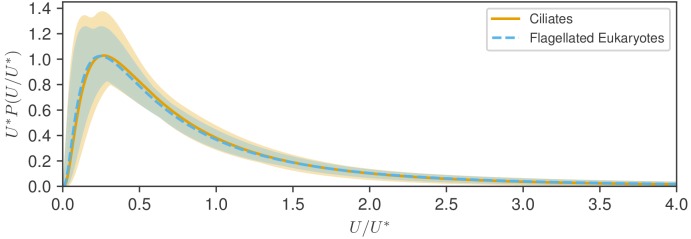
Figure 4. Test of rescaling hypothesis.
Shown are the two fitted log-normal curves for flagellates and ciliates, each multiplied by the distribution median , plotted versus speed normalized by . The distributions for show remarkable similarity and uncertainty of estimation.


