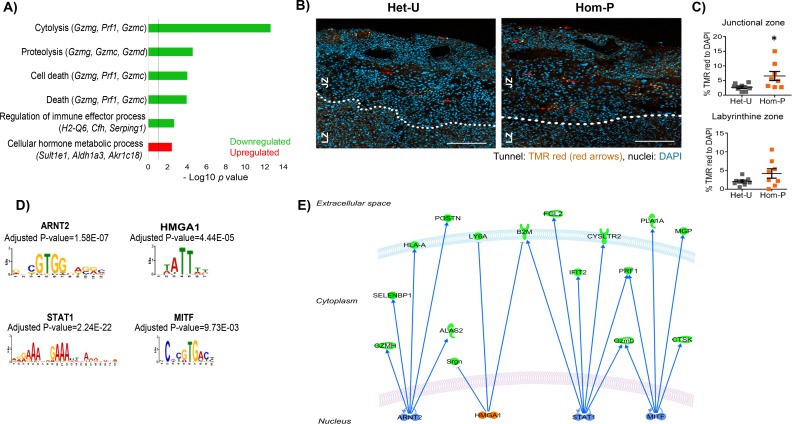
Figure 6. Genes downstream of p110α in the trophoblast implicated in changes in placental phenotype on day 19 of pregnancy.
(A) Top-scoring biological processes enriched in Hom-P (n = 4) versus Het-U (n = 5) placentas on day 19 determined by RNA-seq (see also Figure 6—source data 1). GO terms enriched in up-regulated genes shown in red and those down-regulated in green. Three genes with the highest fold expression changes are indicated in parentheses. The line corresponds to p=0.05. (B) Representative photomicrographs of increasing magnification of cells in the placenta undergoing apoptosis in situ in Het-U and Hom-P mutants on day 19 of pregnancy. Arrows indicate cells undergoing cell death (Tunnel: TMR red, nuclei: DAPI). (C) Quantification of cells in the placenta undergoing apoptosis in situ for Het-U (n = 8) versus Hom-P (n = 8) on day 19 of pregnancy. Scale bar = 200 μm, Tunnel: TMR red, nuclei: DAPI, Jz = Junctional zone, Lz = labyrinth zone. *p<0.05, unpaired t test. Data presented as individual values with means ± SEM shown. (D) Transcription factors with binding sites enriched at the promoters of differentially expressed genes, as identified by Analysis of Motif Enrichment (AME). (E) Regulatory network built with the four TFs identified by AME analysis using ingenuity pathway analysis. In green are shown proteins that are down-regulated at mRNA level in Hom-P versus Het-P placentas, in blue are depicted TFs predicted as repressors and in orange TFs predicted as activators.
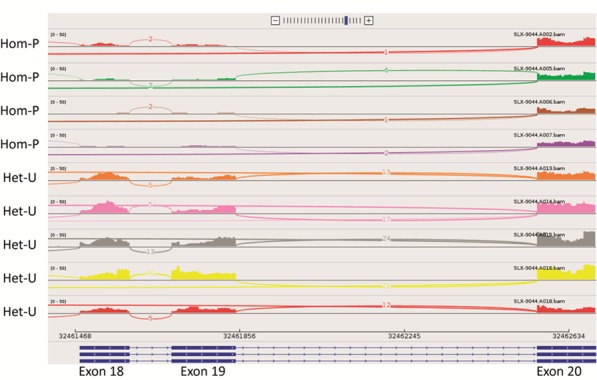
Figure 6—figure supplement 1. Sashimi plot showing RNA-seq reads for exons 18-20 of Pik3ca for the 4 Hom-P and 5 Het-U placentas analysed on day 19 of pregnancy.


