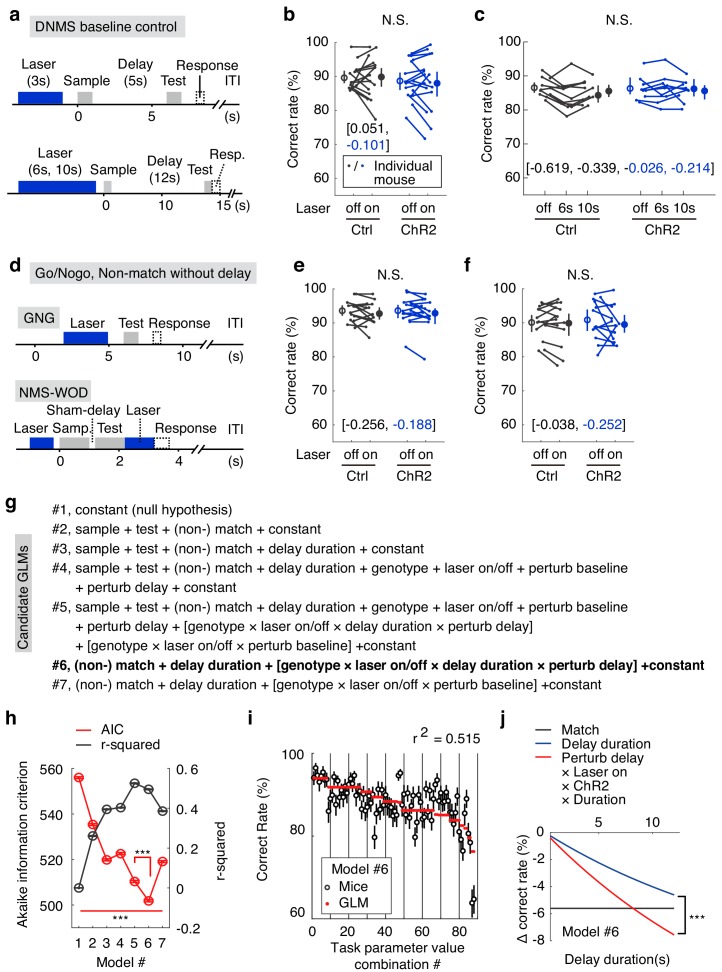
Figure 3. The optogenetic suppression effects were not due to impaired sensory perception.
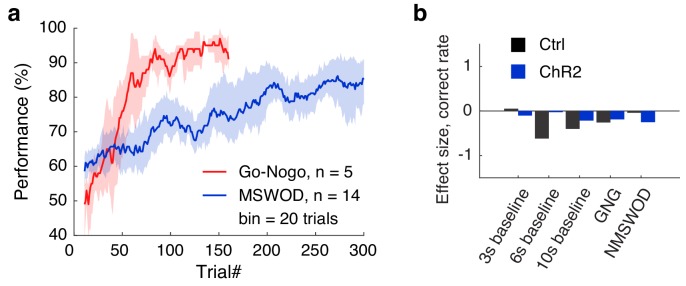
(a) Designs of the DNMS-baseline optogenetic control task. (b, c) Correct rates in the DNMS-baseline perturbation control task with 3 s perturbation and 5 s delay (b) and with 6 s and 10 s perturbation and 12 s delay (c). N.S., statistically not significant, mixed-between-within-ANOVA, genotype × laser interaction; error bars represent the 95% confidence interval of the mean from bootstrapping of 1000 repeats. Numbers in brackets are the effect size measured by Cohen’s d for control (in black) and ChR2 (in blue) groups. (d) Designs of the Go/No-go (GNG) and non-match to sample without delay (NMS-WOD) optogenetic control tasks. (e, f) Correct rates in the GNG and NMS-WOD control tasks. N.S., statistically not significant, mixed-between-within-ANOVA, genotype × laser interaction; error bars represent the 95% confidence interval of the mean from bootstrapping of 1000 repeats. Numbers in brackets are the effect size measured by Cohen’s d for control (in black) and ChR2 (in blue) groups. (g) Design of the candidate generalized linear models (GLMs). The task parameters in each model were then used to fit task performance. Terms in square brackets represent interactions. (h) Comparison of the candidate GLMs in terms of Akaike information criterion (AIC) and r-squaredin explaining performance, between all models, and between model 5 and 6. ***, p<0.001, in a permutation test of 1000 repeats. (i) Performance of mice in the WM tasks versus the optimized model (#6 in (g)) coefficients were calculated from all experimental trials, see Materials and methods). Error bars represent 95% confidence intervals of means from bootstrapping of 1000 repeats. (j) Comparison showing the predicted effect size against delay duration, with coefficients derived from parameters in model #6. Shadow represents the 95% confidence intervals of means from bootstrapping of 1000 repeats (the confidence interval is very narrow and may appear invisible). ***, p<0.001 in comparisons of the coefficients of delay-duration and the effect of delay-period laser perturbation (interaction among perturb-delay, laser-on, ChR2-genotype and delay-duration, see Materials and methods) in the model, permutation test with 1000 repeats. See Figure 3—figure supplement 1, for the comparison of the learning curve in GNG and NMS-WOD tasks and comparison of the effect size of optogenetic suppression. See Figure 3—source data 1–4 for complete statistics.


