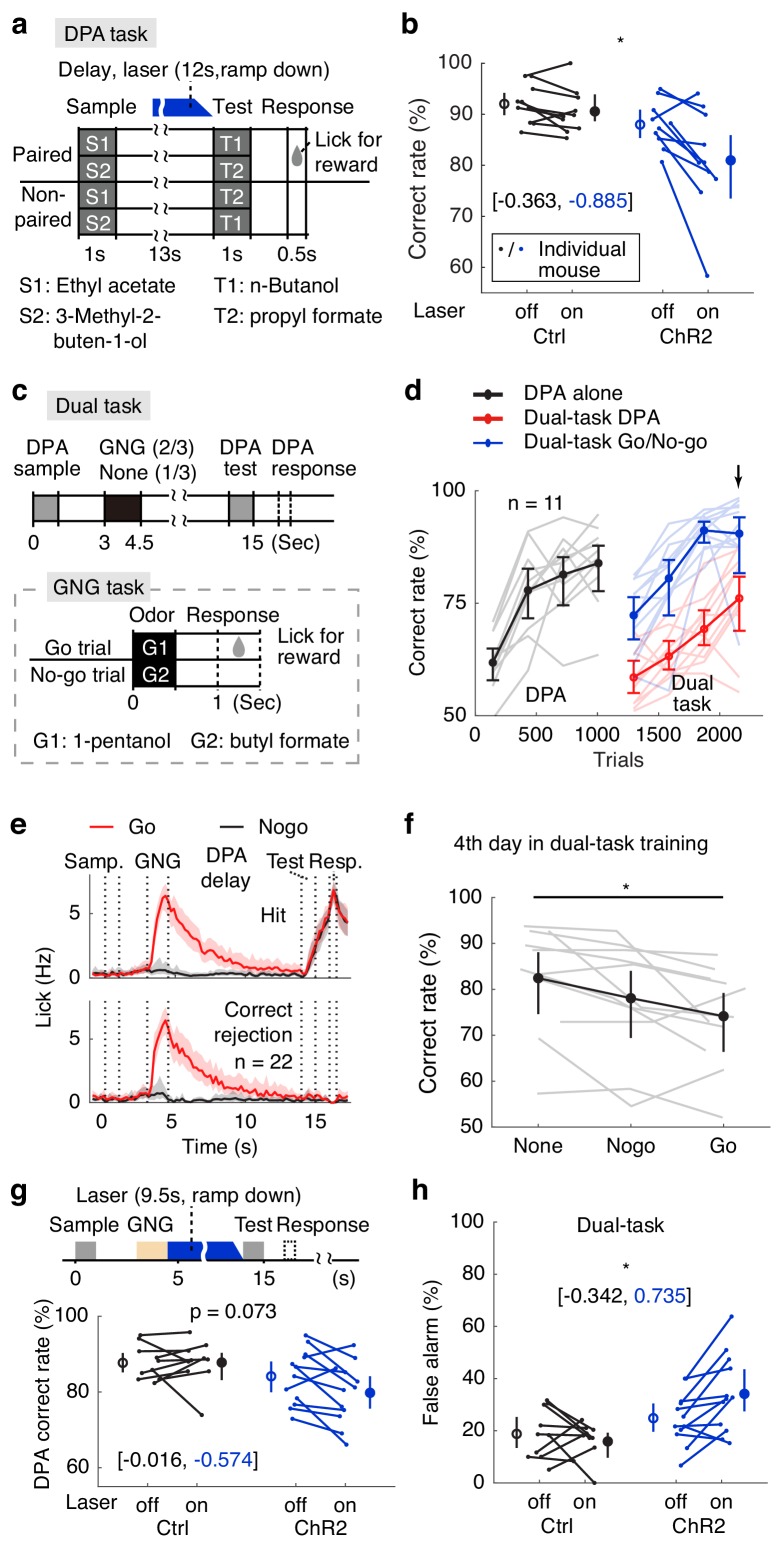
Figure 4. Active memory maintenance by the APC delay activity.
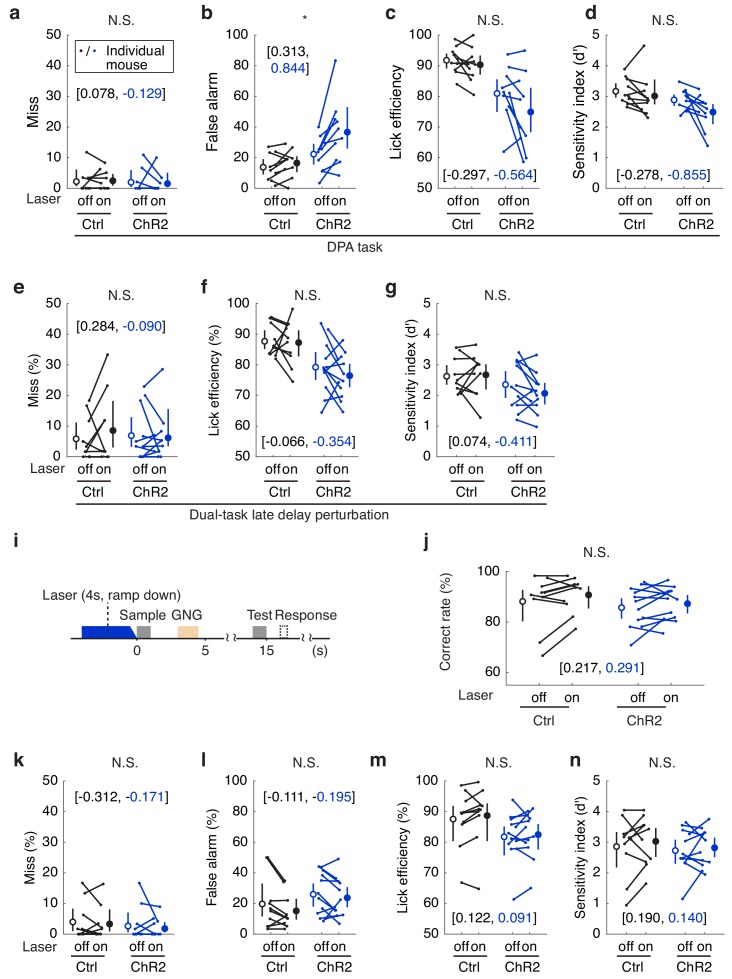
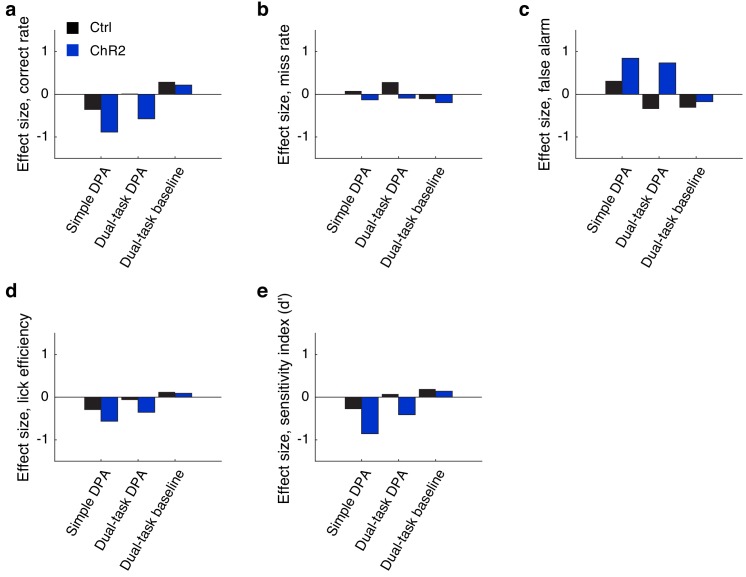
(a) Design of the delayed paired association (DPA) task. (b) Correct rates following APC delay-period optogenetic suppression in the DPA task. *, p=0.038, as determined by a mixed-between-within-ANOVA, genotype × laser interaction; error bars represent the 95% confidence intervals of the means from bootstrapping of 1000 repeats. Numbers in brackets show the effect size measured by Cohen’s d for control (in black) and ChR2 (in blue) groups. We noticed some performance variations resulting from DPA optogenetic impairment, and confirmed that there is no outlier with both the 1.5 interquartile ranges and the Grubb’s methods. (c) Behavioral diagram for the dual-task design. (d) Learning curve for the correct rate in the dual-task. Note the drop of DPA performance after inserting the GNG task in the delay period (in red). Arrow, the 4th day in dual-task training. Light-color traces show the data for individual mice; error bars represent the 95% confidence intervals of the means from bootstrapping of 1000 repeats. (e) Averaged licking rate of mice well-trained for the dual-task in GNG-Go (red), GNG-Nogo (black), DPA-hit (top) and DPA-correct rejection (bottom) trials. Shadows show the 95% confidence interval of the mean from bootstrapping of 1000 repeats. (f) Dual-task interference as illustrated by performance data from the 4th day of dual-task training. *, p=0.041, one-way repeated measure ANOVA. Gray traces show data for individual mice; error bars show the 95% confidence interval of the mean from bootstrapping of 1000 repeats. (g) DPA-Correct rate after suppressing the APC activity during the later-phase delay period after distractors. P values were obtained from mixed-between-within-ANOVA, genotype × laser interaction; error bars show the 95% confidence intervals of the means from bootstrapping of 1000 repeats. Numbers in brackets represent the effect size as measured by Cohen’s d for control (in black) and ChR2 (in blue) groups. (h) As in (g), but for DPA-false alarm rate. *, p=0.014. See Figure 4—figure supplement 1 for more details for the task performance and control tasks. See Figure 4—figure supplement 2 for optogenetic suppression effect size. See Figure 4—source data 1–2 for complete statistics.


