. 2019 Jul 16;8:e47815. doi: 10.7554/eLife.47815

Figure 3. N.oceanica benefits from co-culture with M. elongata.

(A–C) Viability assay of Noc cells and Noc co-cultured with AG77 under nitrogen (-N, (A) and carbon (-C, (B) deprivation. Dead Noc cells were indicated by SYTOX Green staining (green fluorescence). Red, Noc chlorophyll fluorescence. (C) Viability of nutrient-deprived Noc cells increased when co-cultured with two different M. elongata strains, AG77 and NVP64. Results are calculated from 1000 to 5000 cells of five biological repeats with ImageJ. Asterisks indicate significant differences compared to the Noc control as determined by Student’s t test (*p≤0.05, **p≤0.01; Means ± SD, n = 5). (D and E) Total organic C and dissolved N measurements in the buffer of 18-day fungal cultures of M. elongata strains AG77 and NVP64 compared to the f/2 medium control (f/2 con). Fungal cells were removed by 0.22-μm filters. Data are presented as the average of four biological replicates and asterisks indicate significant differences compared to the f/2 medium control as determined by Student’s t test. Means ± SD, n = 4. *p≤0.05, **p≤0.01.
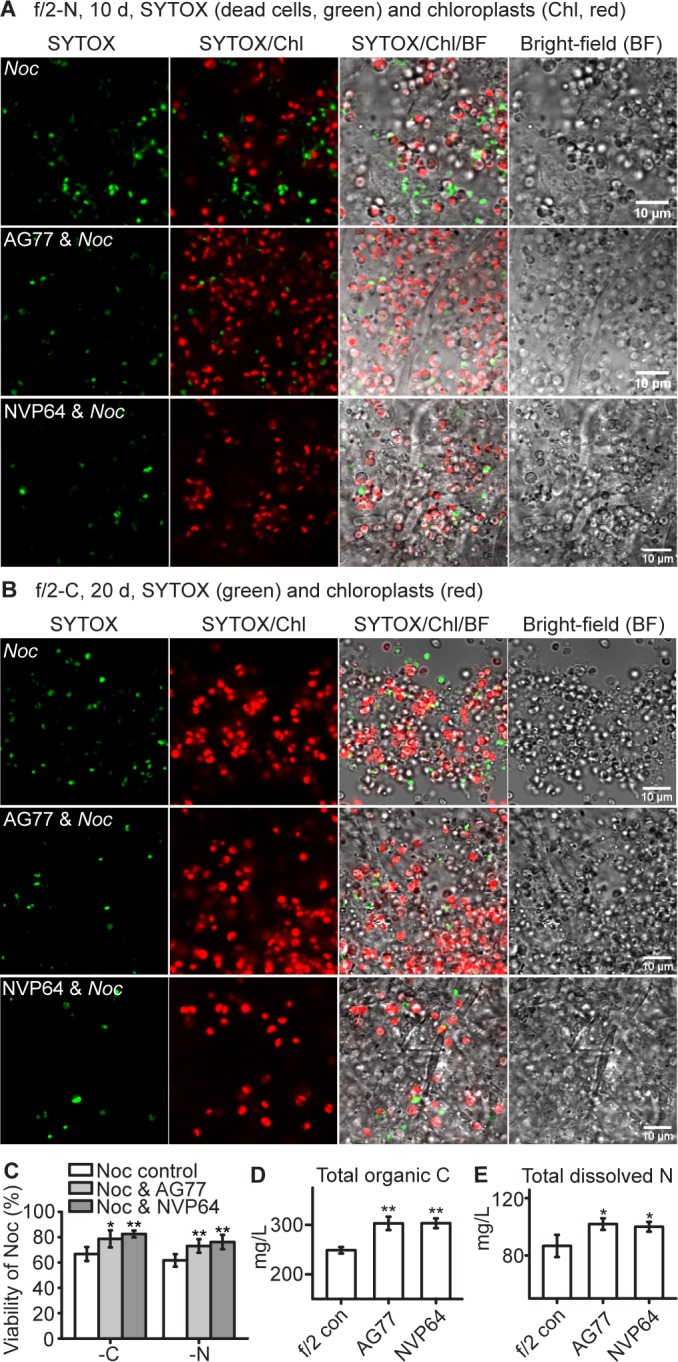
Figure 3.

Figure 3—figure supplement 1. N. oceanica and M. elongata under stresses.

Figure 3—figure supplement 1.

N. oceanica and M. elongata under stresses. (A) N. oceanica (Noc) benefits from co-culture with M. elongata following prolonged cultivation. Stationary-phase Noc cells (0 day control) were kept growing alone or f/2-washed and blot-dried AG77 mycelium were added for 10-day-prolonged incubation. The algae control and unbound algae of the co-culture were used for chlorophyll measurement. Significant chlorophyll degradation was observed in the Noc-alone culture but not in the co-cultured cells. Letter a indicates significant difference compared to the 0 day Noc control; letter b indicates significant difference compared to the 10 days Noc-alone cells (p≤0.05). Values are shown as the average of five biological replicates with standard deviation. (B–F) Viability assay of M. elongata AG77 grown in f/2 medium. Representative confocal micrographs for the detection of dead cells in M. elongata AG77 incubated in f/2 medium for 0 (B), 9 (C), 18 (D) and 30 days (E) using SYTOX Green staining (green fluorescence). Very few dead cells were observed at or before 18-day incubation, which is the same period as for the samples used for organic carbon and dissolved nitrogen measurements in Figure 3D and E. More dead cells were found at 30 days (E), but this number is still very low compared to the heat-killed control (F). Left panel, SYTOX Green fluorescence; right panel, SYTOX/bright field.
Figure 3—figure supplement 2. N.oceanica and M. elongata AG77 benefit from each other under nutrient starvation.
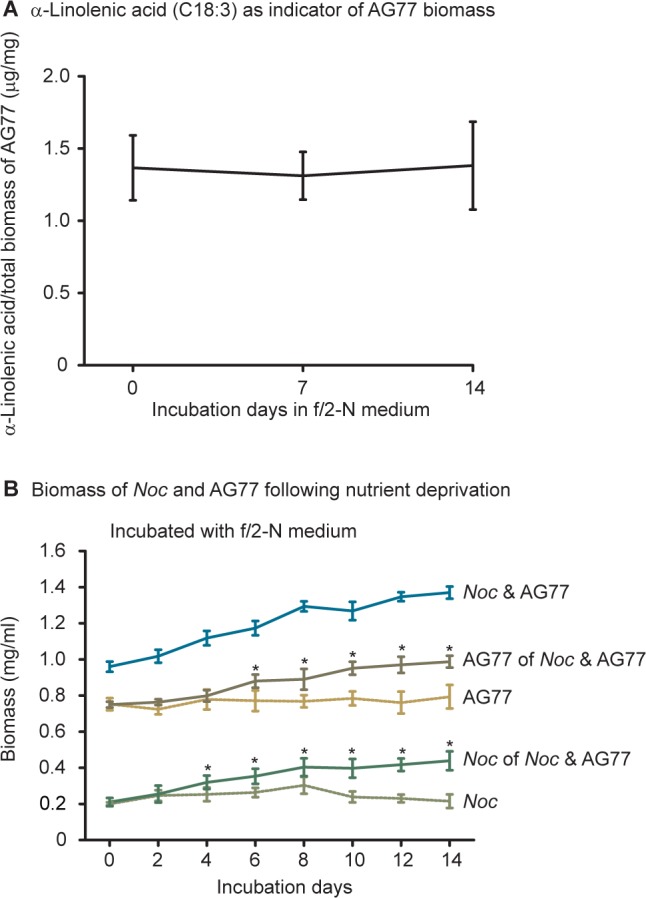
Figure 3—figure supplement 2.

N. oceanica and M. elongata AG77 benefit from each other under nutrient starvation. (A) Biomass calculation of M. elongata using linolenic acid (C18:3) as a biomarker, a fatty acid present in AG77 but not in N. oceanica (Noc). The C18:3 composition in total biomass was consistent following the incubation in N-deprived f/2 medium. Values are shown as the average of four biological replicates with standard deviation, n = 4. (B) Dry weight measurement of Noc and AG77 following nutrient starvation. Three groups of samples (Noc, AG77, and Noc and AG77) were washed and incubated in N-deprived f/2 medium (f/2 N) for up to 14 days and were harvested by centrifugation for further fatty acid and biomass measurements at indicated days. Total lipid of Noc-AG77 aggregates was extracted and the cell lysate was dried for the total biomass of Noc and AG77. C18:3 fatty acid methyl esters were determined by gas chromatography and the biomass of AG77 was calculated with C18:3 as a proxy to quantify the fungal biomass taking into account that the C18:3 composition in the fungal biomass was consistent following the incubation in N-deprived f/2 medium. The biomass of Noc in co-culture with AG77 was obtained by subtraction of the AG77 biomass. Noc and AG77 grown by themselves were used as negative controls that did not have obvious increase in biomass following nutrient starvation. Asterisks indicate significant differences (*p≤0.05) between AG77 and AG77 of Noc and AG77 or between Noc and Noc of Noc and AG77 as determined by Student’s t test. Data are presented as the average of four biological replicates with error bars indicating SD (n = 4).
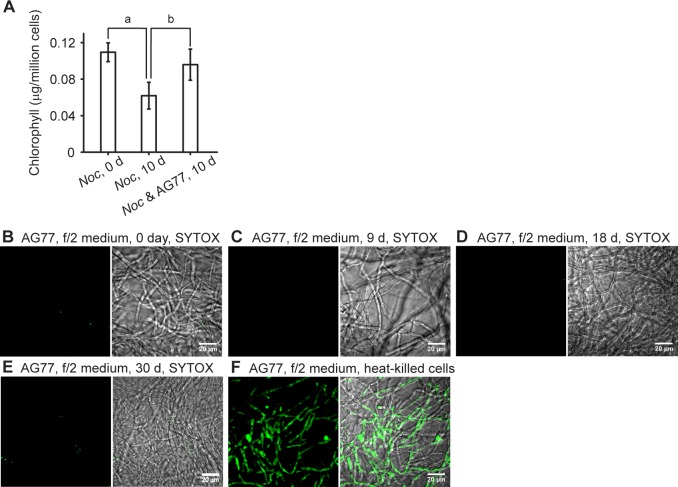
Figure 3—figure supplement 3. Screening of fungal isolates from diverse clades for intensive interaction with N.oceanica.

Figure 3—figure supplement 3.

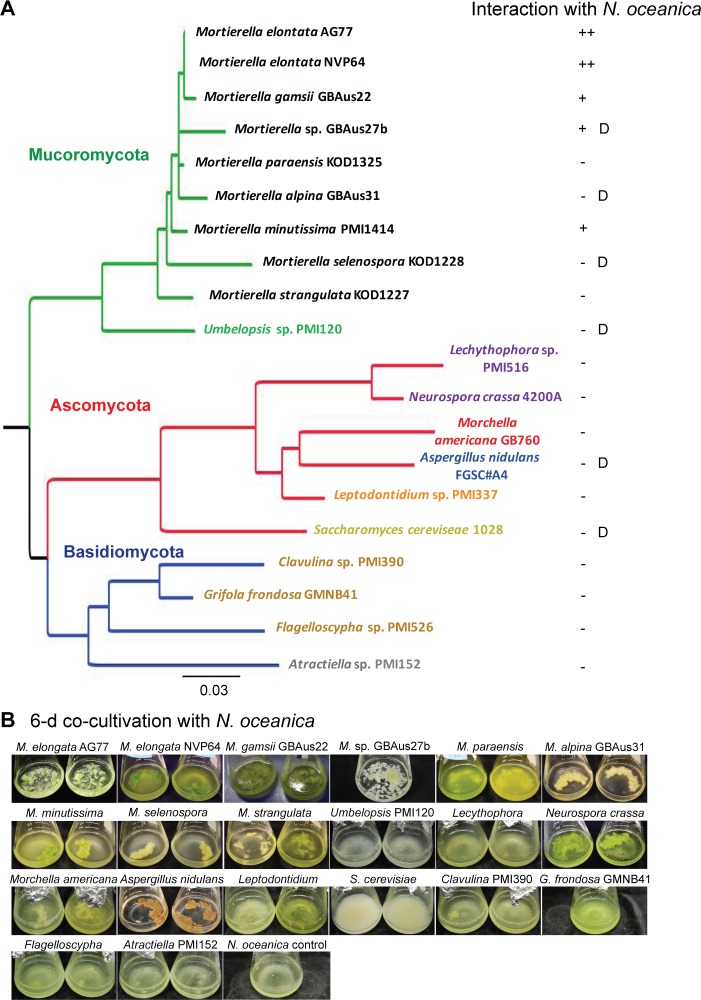
Screening of fungal isolates from diverse clades for intensive interaction with N. oceanica. (A) Phylogram based on partial 28S ribosomal DNA sequence data shows the phylogenetic diversity of fungi tested through interaction studies with N. oceanica. Phylogenetic analysis was carried out using the neighbor joining optimization criterion and major groupings are congruent with current understanding of the fungal phylogeny. Phyla are distinguished by branch colors: Mucoromycota (green), Ascomycota (red), Basidiomycota (blue). Taxa are colored in respect to the Order that they belong to: Mortierellales (black), Umbelopsidales (green), Helotiales (orange), Pezizales (red), Eurotiales (blue), Sordariales (purple), Saccharomycetales (yellow), Atractiellales (gray) and Agaricales (brown). Interactions between N. oceanica and the fungi were evaluated after 6-day co-cultivation briefly based on the amount of cells attached to the fungal mycelia (green dots and pieces): ++, obvious green pieces such as AG77 and NVP64; +, relatively fewer green dots such as GBAus27b; -, no green cells observed while the culture is green such as M. paraensis; D, algal cells are dead after the co-culture, such as for GBAus31. (B) Images of N. oceanica cells co-cultured with different fungal species in flasks containing f/2 medium for 6 days.
Figure 3—figure supplement 4. Scanning electron microscopy of co-cultures of N.oceanica with two fungal strains that did not trap N. oceanica cells.

Figure 3—figure supplement 4.

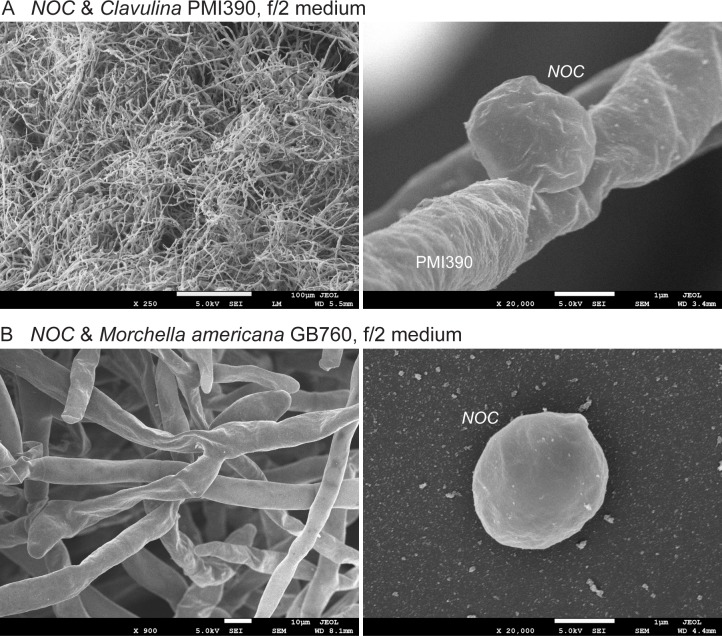
Scanning electron microscopy of co-cultures of N. oceanica (Noc) with two fungal strains that did not trap Noc cells. (A) Noc and Clavulina PMI390 in f/2 medium for 6 days. A few Noc cells were found attached to the hyphae, which has a smooth surface (right panel). (B) Noc and Morchella Americana GB760 in f/2 medium for 6 days. Noc cells were hardly found in the mycelium. The right panel shows a free Noc cell in the co-culture.