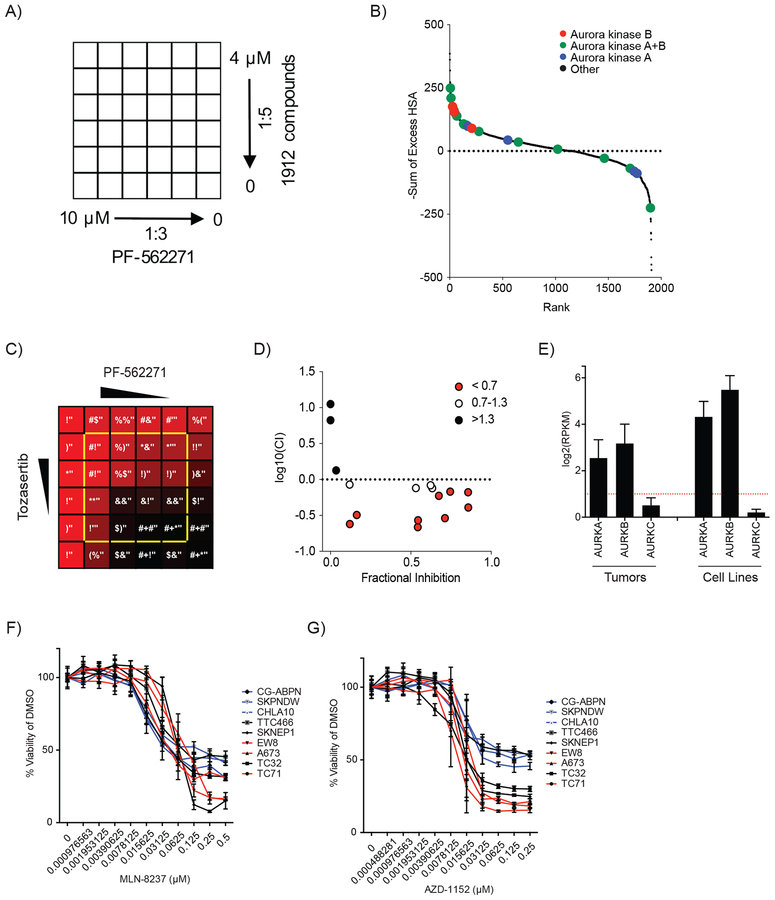
Figure 1. Screening for synergistic compounds with FAK inhibitors in Ewing sarcoma nominates the combination of FAK and Aurora kinase inhibitors.
(A) Schema depicting the treatment matrix layout used in the initial screen testing the effects of compounds from the MIPE 4.0 library in combination with PF-562271 in A673 cells. (B) Scatter plot depicting the results of the initial synergy screen with Aurora kinase inhibitors highlighted by the indicated colors. Scores are plotted as the negative Sum of Excess over HSA for each matrix of combinations such that the highest scoring compounds rank as having the highest synergistic interactions. Scores for each combination are available in Supplemental Table S6. (C) Heatmap depicting screening data of the effect of combination treatment with tozasertib and PF-562271 (the top scoring Aurora kinase combination from the screen) on A673 cell viability. Color scheme depicts the effect of each combination of compound concentrations on cell viability from the greatest inhibition of viability (red) to no inhibition of viability (black) with percent viability relative to vehicle treated cells (normalized across the entire screen) in white text. Combinations plotted in panel D are outlined in yellow. (D) Scatter plot of the log10 normalized Combination Index value vs. fractional inhibition of viability for each treatment combination outlined in yellow in panel C. Combinations with a CI <0.7 (indicating synergy) were plotted in red, CI = 0.7–1.3 (indicating additivity) are plotted in white, and CI >1.3 (indicating antagonism) are plotted in black. (E) Bar plots of Aurora kinase A, B, and C expression for 23 Ewing sarcoma tumors and 9 Ewing sarcoma cell lines. Reads per kilobase per million mapped reads (RPKM) for genes were calculated as previously reported (5). (F-G) Treatment dose response curves of 9 Ewing sarcoma cell lines treated for two days with (F) MLN-8237 or (G) AZD-1152. Viability was normalized to the average viability of the vehicle (DMSO) treated cells. Plotted is the mean normalized viability of four replicates +/− the SD. Cell lines are color coded by their rate of increase of relative viability when treated with vehicle (red are rapidly dividing, black are intermediate, and blue are slowly dividing) as plotted in Supplemental Figure S2A.

