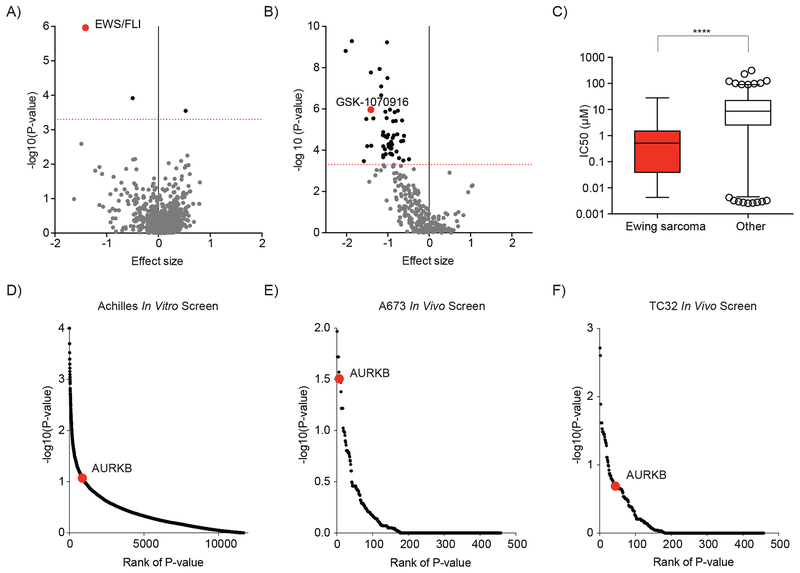
Figure 3. Ewing sarcoma cell lines are dependent on Aurora kinase B.
(A-C) Data and analysis for associations between cancer features and drug sensitivity in cancer cell lines was obtained from The Genomics of Drug Sensitivity in Cancer Project (16). (A) Scatter plot of 690 cancer features that are associated with sensitivity or resistance to treatment with GSK-1070916 (an Aurora kinase B-selective inhibitor). The EWS/FLI cancer feature is highlighted in red. (B) Scatter plot of the correlation between the expression of an EWS/FLI translocation and the sensitivity of cell lines to treatment with 265 compounds. Negative effect size values indicate correlations with treatment sensitivity and positive values indicate correlations with resistance to treatment. Dotted red line indicates a P value = 0.0005. Compounds with a P value < 0.0005 are indicated by black dots, P > 0.0005 are grey. GSK-1070916, an Aurora kinase B-selective inhibitor is highlighted in red. (C) Box plot of IC50 values for 933 cell lines treated with GSK-1070916. In each box, the central line indicates the median and the box extends to the 25th and 75th percentiles. Error bars indicate the range of 1st to 99th percentiles with individual circles indicating outliers. Ewing sarcoma cell lines are compared to all other cell lines by a two-tailed Mann-Whitney test (**** P < 0.0001). (D) Scatter plot of the significance of Ewing sarcoma cell line dependency on expression of targeted genes in an in vitro genome-scale shRNA screen (18). AURKB is highlighted in red. (E-F) Scatter plot of the significance of (E) the A673 and (F) the TC32 Ewing sarcoma cell line dependency on expression of targeted genes for tumor progression in a mouse xenograft shRNA dependency screen targeting 449 genes. AURKB is highlighted in red.

