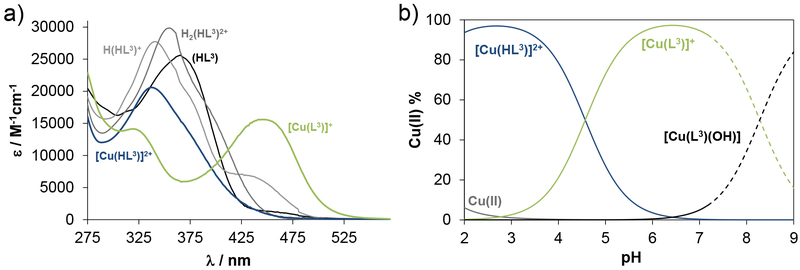
Figure 5.
a) Molar absorbance spectra computed for proligand HL3 and complex 3 in the various protonation states, and concentration distribution curves for 3 plotted against the pH. (Dashed lines show the region where precipitate appears.) {ccomplex = 12.5 μM; T = 298 K; I = 0.10 M (KCl); 30% (w/w) DMSO-H2O}.

