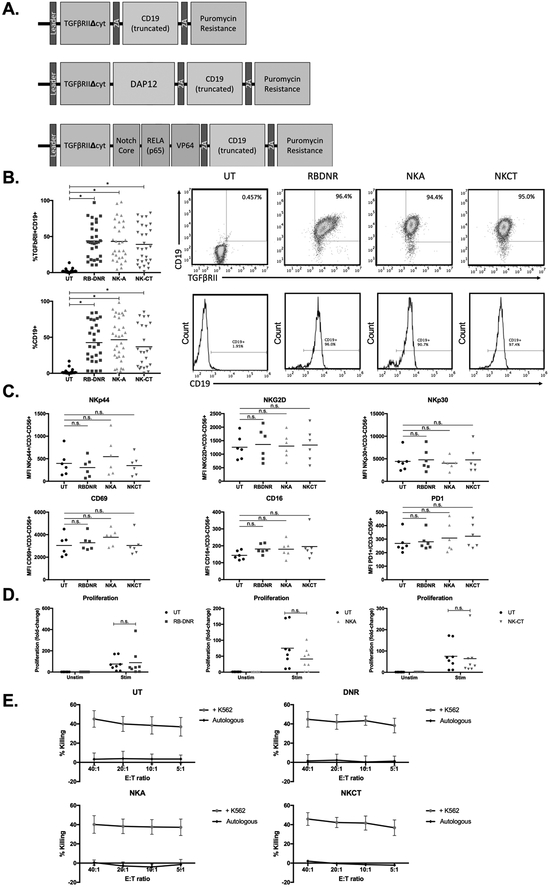
Fig. 2. Generating and characterizing TGFβ receptor-modified NK cells.
(A) Vector maps of RBDNR (top), NKA (middle), and NKCT (bottom) constructs. (B) Flow cytometry demonstrating transduction efficiency based on TGFβRII and/or CD19 positive staining. Representative flow dot plots and histograms are on the right, and summarizing data on the left. (C) The phenotype of transduced and untransduced NK cells were examined by flow cytometry, and mean fluorescent intensity values for a given surface receptor is depicted in each panel. (D) Transduced and untransduced NK cells were stained with CFSE, and stimulated with irradiated feeder cells. After 3 days, cells were harvested and assessed for CFSE dilution by flow cytometry. (E) 51Cr-labeled K562 target cells were co-cultured at various effector:target ratios with transduced or untransduced NK cells, and cytotoxicity after 5 hour co-culture was determined based on chromium content in the supernatant, calculated with spontaneous and maximum release controls. All data is representative of experiments with >8 donor lines, with * indicating significant p values <0.05.

