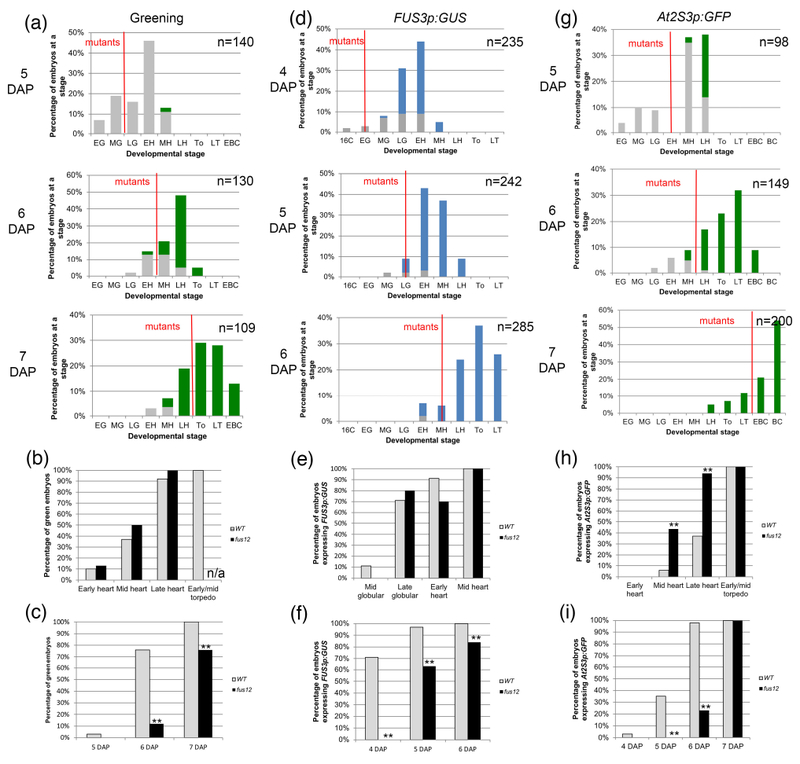
Figure 2: Greening and expression of maturation reporters in fus12 embryos.

(a, d, g) Distribution of embryo stages in FUS12/fus12 siliques at different times after pollination. The embryos to the left of the red line are the fus12 embryos. A red line bisecting a bar indicates that the stage contained both wild type and mutant embryos. Stages: E; early; M: mid; L: late; 16C: 16-cell; G: globular; H: heart; T: torpedo (To: early/mid torpedo); BC: bent cotyledon. (a) Embryo greening. Gray bars denote white embryos, green bars green embryos. (b) Green embryos from the graphs in (a) sorted by developmental stage. (c) Green embryos from the graphs in (a) sorted by developmental time (DAP). (d) Expression of FUS3p:GUS. Gray bars denote GUS− embryos, blue bars GUS+ embryos. (e) GUS+ embryos from the graphs in (d) sorted by developmental stage. (f) GUS+ embryos from the graphs in (d) sorted by developmental time (DAP). (g) Expression of At2S3p:GFP. Gray bars denote GFP− embryos, green bars GFP+ embryos. (h) GFP+ embryos from the graphs in (g) sorted by developmental stage. (i) GFP+ embryos from the graphs in (g) sorted by developmental time (DAP). For (b), (c), (e), (f), (h) and (i) the sample sizes per condition and p-values from Fisher’s Exact Test between wild type and mutant are listed on Tables S2a-c (*: p < 0.05; **: p < 0.01). n/a: not applicable, the mutant embryos hadn’t reached that stage by the last time point.
