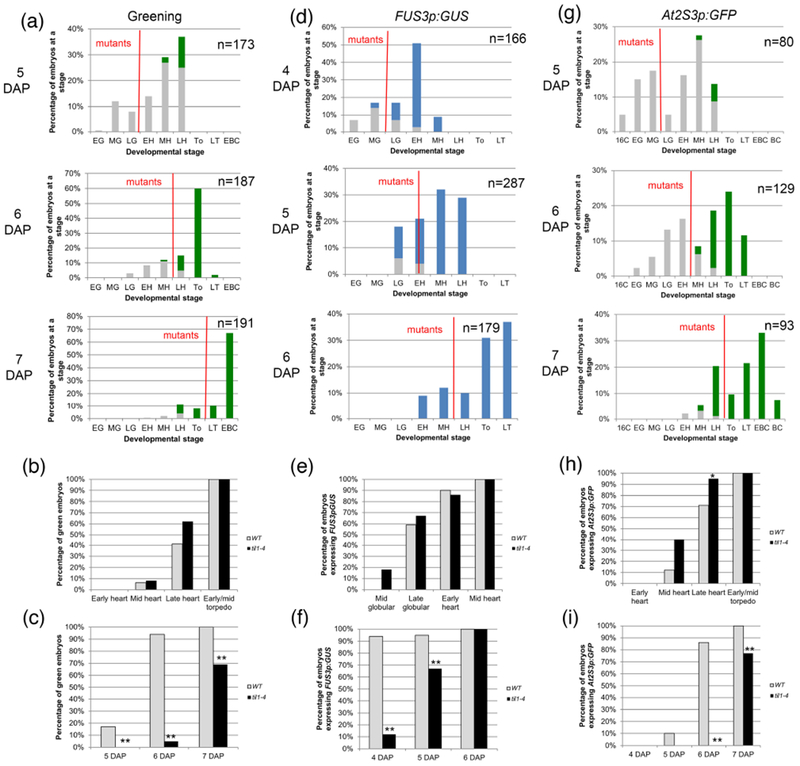
Figure 3: Greening and expression of maturation reporters in til1-4 embryos.

(a, d, g) Distribution of embryo stages in TIL1/til1-4 siliques at different times after pollination. The description of panels (a) to (i) is the same as in Figure 3. For (b), (c), (e), (f), (h) and (i) the sample sizes per condition and p-values from Fisher’s Exact Test between wild type and mutant are listed on Tables S2a-c.
