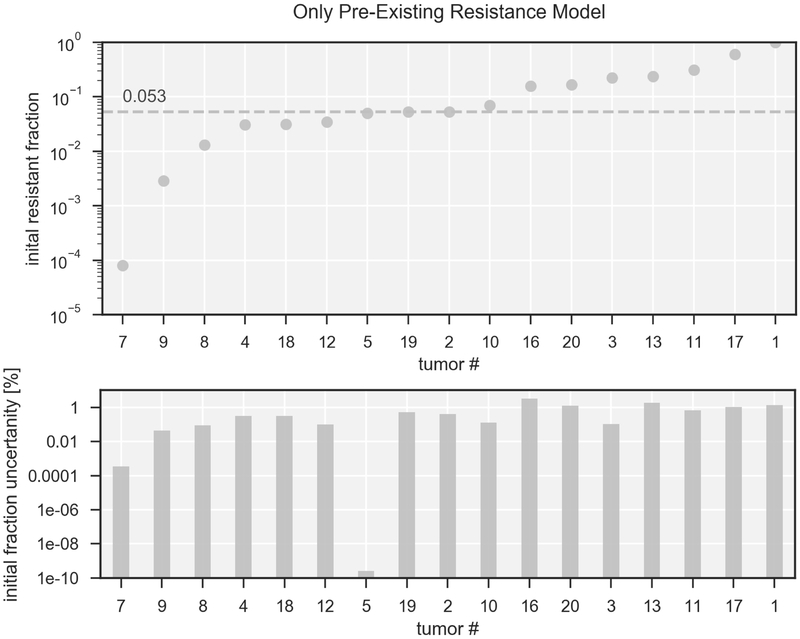
Fig 4. Population sizes expressed as fractional volume at treatment start assuming only pre-existing resistance.
Top: Fraction of pre-existing resistance in logarithmic scale for 17 tumors, ordered by fraction of pre-existing resistance. The labeling corresponds to Table 1. Bottom: error estimates given by the fitting procedure for the fractional volume, displayed as fraction of the total clonogen number. To view the error expressed as percentage of the initial fraction please consult the supplementary material.

