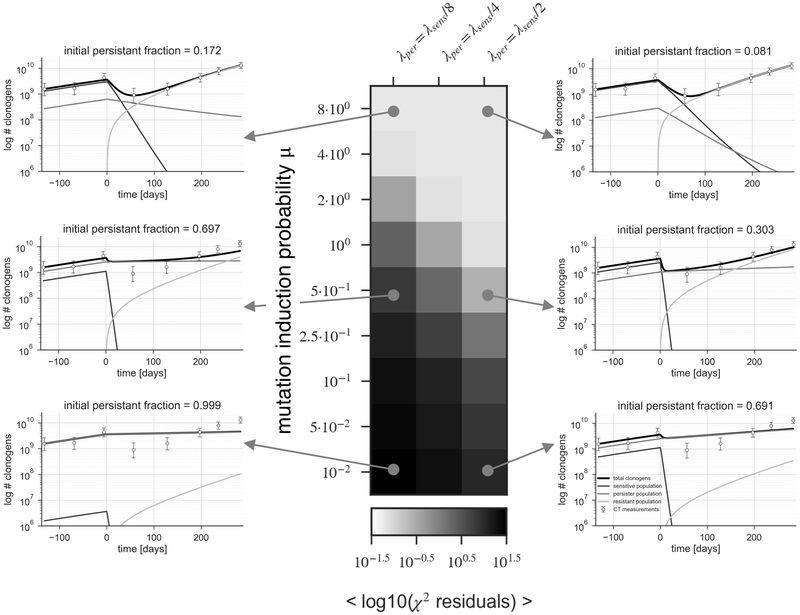
Fig 5. Parameter estimation for the persister-evolution model.
The panel represents results for three choices of persister growth rate λ (1/2, 1/4 and 1/8 of the untreated growth rate), and several choices of compound mutation induction probability ranging from 10−2 to 8. The colorbar represents the goodness of fit quantified by the residuals of the least-square parameter optimization in logarithmic scale.

