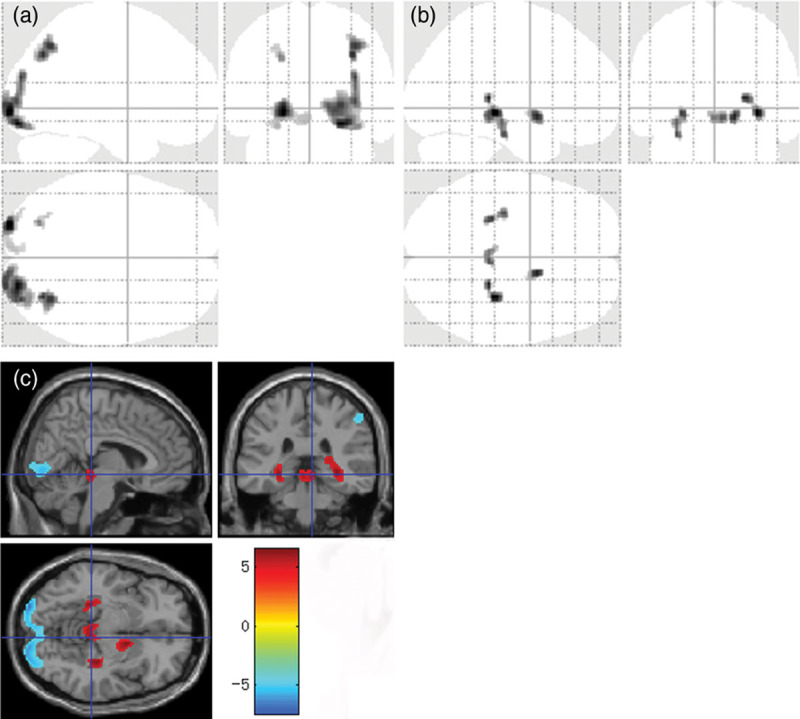
Fig. 2.

Both decreased and increased brain FDG uptake in patients with cirrhosis. SPM ‘glass brain’ regions with (a) decreased glucose uptake and (b) increased glucose uptake. (c) PET findings from a voxel-based statistical t image overlaid on a magnetic resonance image show clusters of abnormal glucose metabolism in patients with cirrhosis (P < 0.001 relative to controls; >50 continuous voxels; corrected for multiple comparisons via a family-wise error method). The colored bar represents t-values, and the display threshold is set at |t| > 5.2. SPM, statistical parametric mapping.
